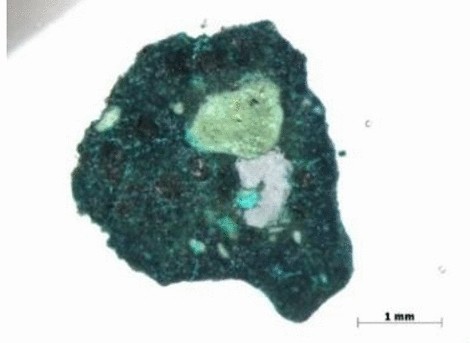
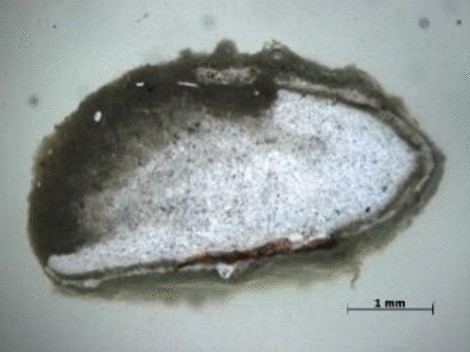
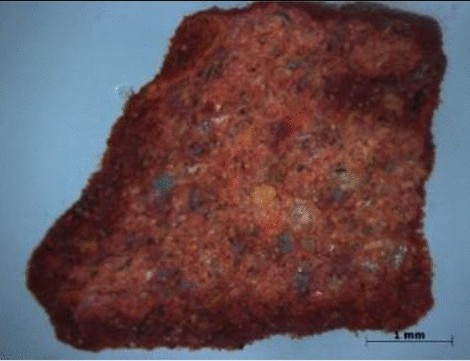
Sample | Green | White | Red |
|---|
Optical micrograph |
 |
 |
 |
|---|
SEM–EDS | Concentration (wt%) |
|---|
C | O | Mg | Al | Si | Cl | K | Ti | Fe | Pb | Cu | Sn | Total |
|---|
Green | 64.93 | 22.36 | – | 0.78 | 4.77 | 0.33 | 0.41 | – | 0.19 | 1.68 | 4.09 | 0.46 | 100 |
White | 16.08 | 51.22 | 0.77 | 7.42 | 18.46 | – | 4.12 | 0.58 | 1.35 | – | – | – | 100 |
Red | 32.97 | 43.35 | 0.32 | 5.80 | 7.80 | – | 1.59 | 0.37 | 7.81 | – | – | – | 100 |