- Research article
- Open access
- Published:
The limited impact of acetic acid in archives and libraries
Heritage Science volume 6, Article number: 59 (2018)
Abstract
For over two decades the exposure of paper heritage collections to outdoor and indoor generated gaseous pollutants has been perceived as an important threat to their preservation. Following explicit or implicit advise from conservation science, many archives, libraries and museums have implemented special chemical filtration units to prevent possible pollution induced damage. The most abundant, potentially harmful, indoor generated pollutant found in paper loaded storage rooms is acetic acid. Acids are known to promote the chemical degradation of cellulose, the major constituent of paper. These combined facts make clear why acetic acid has received much attention by conservation science as a prime suspect pollutant causing paper degradation. However, new experimental evidence contradicts the claim that acetic acid in typical storage situations causes significant damage to paper heritage. In this study a mathematical model is presented that expresses our understanding of the causal chain of processes connecting acetic acid exposure to paper damage. The model simply combines existing partial models describing (1) the transfer of acetic acid through air, (2) the pH response of paper and (3) the kinetics of acid-catalyzed hydrolytic depolymerization. The model makes apparent that the impact of acetic acid on archival and library collections is rather limited and poses an insignificant risk and as such requires a re-evaluation of existing data.

Introduction
Concerns
Libraries and archives are increasingly concerned about the possible negative impact of indoor air pollutants on the permanence of their collections. The harmful effects on paper of some gaseous pollutant species identified in archive and library storage rooms have been demonstrated for artificial high temperatures and humidities in various laboratory experiments [1,2,3,4,5,6,7,8,9,10,11]. These experiments, often performed at elevated temperatures, have shown that exposure to gaseous pollutants at artificially high concentrations results in embrittlement and yellowing of paper. Moreover, gas monitoring techniques with low detection limits have become affordable in the last decade so that cultural heritage institutions have performed more frequently indoor air quality campaigns and have become more aware of the range of gaseous components present in the atmosphere of their repositories [12,13,14,15,16,17,18,19,20,21,22]. Confronted with such facts, managers, curators and conservators are pressed to take action to reduce the indoor concentration of pollutants. Unfortunately, air pollution control strategies, like the application of chemical filters in the air conditioning systems of repositories, generate significant financial and environmental costs [23].
Acetic acid
In this study acetic acid was selected as a prime suspect model pollutant from the wide variety of pollutants found typically in the air of repositories, based both on its chemical reactivity and its abundance. The majority of the gaseous pollutants to which paper collections are exposed are considered essentially inert. Only a handful of gaseous substances are described in conservation literature to induce chemical reactions in paper [14]. These pollutants can be subdivided into outdoor generated and indoor generated gases. The effect of the outdoor generated pollutants sulfur-dioxide, nitrogen-oxides and ozone on paper has been studied extensively with accelerated aging laboratory experiments [1,2,3, 5, 6, 24,25,26,27]. Nevertheless, thanks to both policies of outdoor pollution reduction and policies of improvement of the energy efficiency of buildings by reducing the fresh air intake, the typical concentration of such gases in repositories has declined below 5 ppb for sulphur dioxide and ozone and 15 ppb for nitrogen dioxide [28]. Probably as a consequence the focus of conservation research shifted in the last 15 years to investigate the indoor generated pollutants methanal (formaldehyde), ethanoic (acetic) and methanoic (formic) acid [4, 7,8,9,10,11, 16, 29,30,31,32,33,34,35,36]. Indoor emission of formaldehyde from urea–formaldehyde bonded products like fiberboard has been studied thoroughly in connection to human health. The relevance to paper decay is probably small because chemical reactivity is limited in absence of oxidants [9, 37, 38] and concentrations found in archival storage rooms are below 10 ppb [16]. In contrast to the pollutants discussed above, the two carboxylic acids formic and acetic acid are typically found in storage rooms containing paper at concentration levels up to respectively 70 ppb and 150 ppb [14, 16, 17, 19, 21, 22]. In some special situations containing non-paper emitting sources in closed cabinets, higher concentration levels have been reported [39, 40]. Both acids are generated by oxidative and hydrolytic reactions in organic materials like wood and paper [41,42,43]. If absorbed by less acidic paper materials they might promote chemical decay by catalyzing hydrolysis of cellulose. The transfer of chemically reactive volatile components from certain collection objects to others is commonly referred to as cross-contamination. The laboratory-derived experimental evidences of the detrimental effect of acetic acid in typical archival conditions is nevertheless contradictory. Menart and co-authors [10] extrapolating data collected at an intermediate concentration (1000 ppb) and temperature (60, 70 and 80 °C) in a set-up with continuous gas flushing, which guarantees the attainment of equilibrium between the concentration of the gas in air and in the paper, conclude that “the effect (of acetic acid) in typical archival environments is limited and in some cases insignificant”. On the other side in a modified Oddy test for plastic materials performed at 80 °C and for 14 days, acetic acid has been shown to depolymerize pure cellulose paper [44]. In a similar set-up based on the investigation of the impact of historic storage materials on the carbonyl group content and the weight average molar mass of two types of paper, Becker and co-authors [11] conclude that “the mutual evaluation of formic acid and acetic acid is able to explain increased deterioration despite VOC emissions that are seemingly low at first sight”. Prompted by these contradictory evidences we have searched for indications of acetic acid damage on studies examining directly archival collections.
Identical books
Few investigators have tried to obtain direct evidence of pollution damage by comparing near identical paper objects stored under different pollutant exposure conditions for long times. This field study approach has proven cumbersome. An important early study [45] of identical copies of books stored at the New York Public Library and the Dutch National Library (Koninklijke Bibliotheek, Den Haag) revealed large differences with respect to brittleness and yellowing. The significantly worse condition of the New York copies was originally attributed primarily to locally higher concentrations of air pollutants. In retrospect however, their differences can very well be understood to result solely from exposure to higher temperatures and higher humidity levels in New York. As a rule of thumb, “every five degree drop in temperature doubles the lifetime” [46]. More recent comparative field studies [47, 48] show rather similar paper characteristics for identical papers despite different air pollution exposure conditions. This lack of direct evidence for actual pollutant damage motivated us to develop a theoretical model of the interaction of acetic acid on paper under typical archival conditions.
Emission modeling
In order to predict emission and absorption of volatiles by solid materials from limited emission chamber experimental data, distinct theoretical approaches have been developed. Pseudo steady state theories describe volatiles behavior in terms of absorption and emission rates [49], or transfer coefficients [50, 51]. Spatial dynamic theories describe the time dependence of spatial concentration profiles within materials with diffusion models [52, 53]. The apparent incompatibility of these distinct approaches is a source of confusion and has created difficulty in the comparison and interpretation of emission data.
The emission and absorption dynamics of volatile organic compounds by material objects into their environments across time scales ranging from hours to centuries is the result of the interplay of several processes. These are: (1) the introduction during manufacturing or chemical formation over time of a specific volatile compound, (2) internal diffusion, (3) surface evaporation/absorption and (4) ventilation (external convective transport). It can be shown mathematically (see Appendix 1) that the proposed theories can all be derived from a single unified emission model. Their differences are the result of distinct simplifying approximations and should not be seen as opposing ideas about the underlaying mechanisms.
Emission modeling in the context of long term preservation of paper heritage in libraries and archives needs to take into account the behavior of volatiles at rather long time scales of decades or centuries. However, all models mentioned above are developed to fit and extrapolate short term behavior of materials as it can be determined from emission chamber experiments that last days or weeks. The problem with this approach is that short term behavior is primarily determined by resistances within a system, whereas long term behavior is determined by equilibration properties. Another specific modeling difficulty in the context of libraries and archives is the large amounts of non-uniform paper objects. Accurate specification of geometries and other variables at the individual object level is impractical. Within the context of libraries and archives all theoretical approaches mentioned above are inapplicable due to these problems. In the present article we therefore alternatively model the uptake of acetic acid by paper with a simple equilibrium between paper and air. Acetic acid is typically present in paper and as a result of an equilibration process some paper objects that contain higher acetic acid concentrations will release acetic acid and cross-contaminate others.
Although assertive claims have been made to suggest that paper acidifies over time as a result of natural aging [42] and as such would give rise to gradually increasing emissions of acetic acid, there is no evidence to suggest that this happens at a significant rate in ambient conditions. Emission behavior such as reported by Ramalho [34] should not be understood to provide evidence of acetic acid production, as emission is not necessarily due to production. Thermal aging of paper yields significant amounts of acetic acid. This observation has been confirmed in some laboratory studies. For an overview see Jablonský [54]. However, it is unlikely that these conclusions obtained from model systems in laboratory studies can be extrapolated to typical storage situations. A multi temperature study by Baranski [55] indicates a diminishing rate of acetic acid production in paper towards ambient conditions. Also, none of the field studies that we know of do support the acidification claim. For example, a long term repeated study into the condition of books in the Netherlands [56] did not reveal any change in pH over time. Pedersoli [57] analyzed books of different age and found that the acetic acid content is flat with the age. No increase with the age of the book was observed. These findings are in accordance with Zou [58] who observed no significant acid production during natural aging of paper. In conclusion, irrespective of the specific chemical processes that give rise to the presence of acetic acid, the impact of airborne acetic acid is sufficiently modeled by assuming constant acetic acid concentrations within storage rooms.
Pathway model
Our pathway model is composed of three major blocks. Figure 1 shows a diagram of the model structure. The first block describes the cross-contamination process in which exposure to a given concentration of gaseous acetic acid results in an uptake by the paper. We depart from the dose approach and propose an equilibration model between acetic acid in air and in the paper characterized by the partition coefficient. The second block describes the effect of the absorbed acetic acid on the acidity of the paper. As the pH of the paper is well defined only for the paper extract, which is the mixture of a definite volume of water with a definite mass of macerated paper, this block describes the pH shift of the extract upon absorption of acetic acid. The pH shift is found by calculating the new acid–base equilibrium in the extract. The third block describes the de-polymerization given the calculated pH-shift. Here we use a well established Arrhenius type model of paper degradation which depends on the pH, on the water content and on the temperature.
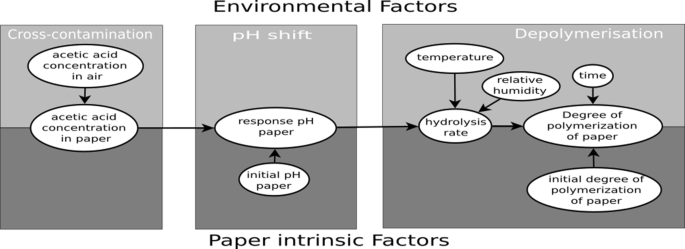
Schematic model structure with environmental and paper intrinsic variables
Cross-contamination
Conservators often observe discolorations where a given paper has been in contact with other low grade material, such as newsprint paper. This fact suggests a transfer of degrading volatile components. It can be inferred that similar cross-contamination processes might also occur across larger distances. In such cases some low grade items act as emissive objects, typically emitting acetic acid, and other items as absorbing objects. The concentration of the acetic acid in air is expected to be higher close to the sources and to depend on the number of emissive versus absorbing objects, on their acetic acid content and on the air ventilation patterns within the room. This picture is complicated by the fact that archives contain a wide variety of not well-defined materials under many different possible geometries. Instead of attempting to model such a complex situation we have decided to take a worst case approach. We disregard how the acetic acid concentration in air arises and look only at the absorbing objects. These are assumed to be in equilibrium with a constant acetic acid concentration of 150 ppb in air, which has been taken as the highest measured concentration reported for paper repositories [14, 16, 17, 19, 21, 22]. This is a worst case approach because for books and stacked papers the content of acetic acid is in reality limited by the slow diffusion in paper. The time needed for acetic acid to diffuse through the whole thickness of a book has been estimated of the order of centuries based on measurements of acetic acid equilibration within the page of a book with an SPME probe [57]. Similar results have been found for the diffusion of acetic acid through roll films [59]. The equilibrium approach in a repository is therefore equivalent to imagining that a library collection is not composed of books or stacked papers but of single sheets freely exposed to the surrounding air. In this case the acetic acid content of the absorbing objects is described by the partition coefficient, which expresses the ratio of the concentration of acetic acid in paper at the equilibrium to the concentration of acetic acid in air.
The paper/air partition coefficient of acetic acid has been shown not to depend significantly on the paper type and its average value has been determined to be [57]:
The paper/air partition coefficient can also be estimated from the published value of the Henry coefficient of acetic acid expressed as concentration ratio K cc H and from the equilibrium moisture content of paper EMC.
The Henry coefficient expressed as concentration ratio was calculated with the values reported by Servant [60] and measured at gaseous concentration of 1 ppm, close to the concentration used in this work. The EMC of paper at 20 °C and 50% RH is estimated equal to 0.085 [61]. The resulting value for p est HAc is 1.9 × 10⁴, in good agreement with the measured value.
pH-shift
The absorption of gaseous acetic acid will cause a shift in the pH of the absorbing objects. This shift will depend on the initial pH of the paper and on the specific acid and alkaline species present. Both of them have large variations within paper collections. Paper generally contains a mixture of moderately strong acids like sulphonic and uronic acid [58, 62], weak acids and various alkaline substances. Such mixtures are expected to buffer the pH change induced by the absorption of acetic acid. Again, instead of modeling this complex situation we model the paper as composed of a single strong, fully dissociated acid or base. This simplified paper model will not be able to buffer the absorption of gaseous acids as well as real papers will do and therefore represents another worst case assumption. The pH of paper can not be measured in dry paper directly, but is well characterized by measuring the pH of a cold aqueous extract of the paper following a standard procedure [63] slightly adapted by [64]. We can predict the pH shift of the aqueous extract after absorption of acetic acid by adapting the calculation of acid–base titration curves as explained in standard text books [65] and reported in Appendix 2. The assumption of electrical charge neutrality results in an implicit expression that relates the hydronium ion concentration before absorption of acetic acid [H3O+]0 (mol L−1) and the hydronium ion concentration after absorption of acetic acid [H3O+] (mol L−1) to the added concentration of acetic acid CAc (mol L−1), given the dissociation constant for acetic acid kAc = 1.74 × 10⁻⁵ (mol L−1) and for water kw = 1.0 × 10⁻¹⁴ (mol2 L−2).
Although this expression can not be easily solved explicitly, further modeling is straightforward by using a numerical inversion. Different pH response curves for different initial pH0 starting values are shown in Fig. 2. For convenience, the secondary horizontal axis displays the acetic acid exposure concentration in air corresponding to the uptake concentration in the paper extract solution.

Predicted pH change of the paper extract upon uptake of airborne acetic acid
In the range of acetic acid concentrations expected in archives and libraries, varying between 0 and 150 ppb, this model predicts an appreciable pH decrease upon absorption of acetic acid only for papers with initial pH between 6 and 8.5. Papers with lower or higher initial pH are virtually unaffected by such an absorption of acetic acid. The pH shift of the extract upon addition of acetic acid has been measured experimentally for papers of different composition and of different initial pH (see Appendix 3). These results have confirmed our expectation that real papers, due to their buffering action, show pH shifts that are smaller than our worst case theoretical prediction.
De-polymerization
The strength of paper correlates with the average degree of polymerization (DP) of the cellulose polymers constituting the paper matrix. The predominant type of chemical reactions leading to loss of DP is hydrolysis. These hydrolytic chain scission reactions are partly catalyzed by hydronium ions. Lower pH levels induced by the absorption of acetic acid will therefore enhance the rate of cellulose de-polymerization. A quantitative model for paper de-polymerization including both acid catalyzed and acid independent hydrolysis has been established by [66, 67] and has been confirmed by other investigators [55, 68]. The model proposed by Zou is based on the Ekenstam equation [69] which describes the change of the number-average degree of polymerization DP(t) as:
where k is the relative rate of glucosidic bond breakage. Zou and co-authors [66] have shown that the temperature dependence of k has an Arrhenius form even when the aging process of paper involves multiple reactions and has proposed in this case a form for the apparent frequency factor and for the activation energy. The apparent frequency factor is composed of three terms, a first term associated to not hydrolysis reactions, a second term associated to hydrolysis reactions and proportional to the moisture content of the paper and a third term associated to acid catalyzed hydrolysis type of reactions and proportional to both moisture content and hydrogen ion concentration.
The parameters A0, A2, A5 and EA have been determined experimentally for bleached chemical pulps:
These values show that the term associated to reactions which are not of the hydrolysis type is negligible with respect to the hydrolysis terms. The term associated to acid catalyzed hydrolysis dominates under the condition [H3O+] > A2/A5 that is to say only if pH < 4.5. This model therefore predicts that only for papers with pH smaller than 4.5 the acid content will play a role in determining the rate of degradation. The equilibrium moisture concentration [H2O](−) is expressed as a mass fraction of the mass of water content over the dry mass of paper. The equilibrium moisture concentration of paper is related to the relative humidity RH (%) in the air through the moisture absorption isotherm. For the sake of simplicity we will assume a linear moisture absorption isotherm characterized by a slope α(−).
The value of α = 0.17 has been estimated from the desorption moisture isotherm published in [61] chapter 4. By assuming that the moisture content and the shifted pH of paper are constant in time and combining Eqs. 4–6 we get:
pH-DP evolution diagram
Combining the expression for the pH-shift (Eq. 3) with the expression for the degree of polymerization over time (Eq. 7) and solving numerically allows to predict the evolution in time of the degree of polymerization for a given exposure level of acetic acid at constant temperature and relative humidity. In agreement with common time horizons used in the risk analysis approach [70, 71] we have chosen to depict the de-polymerization up to a time range of 100 years. Since acetic acid concentrations for paper loaded storage rooms have been reported to have values up to 150 ppb [17], we have chosen to calculate DP changes for this high level in comparison to DP changes for papers unexposed to acetic acid. Figure 3 shows the DP change for a neutral (pH = 7) paper aging at constant RH and temperature (50% RH and 20 °C respectively) and exposed or not to 150 ppb of acetic acid. The de-polymerization due to 100 years of exposure of a neutral paper to 150 ppb is estimated to be only 2% higher than the natural de-polymerization under the same temperature and relative humidity conditions.

Predicted DP change for a neutral paper exposed or not exposed to 150 ppb of acetic acid
Figure 4 shows a comparison of predicted pH and DP evolution over 100 years for 9 papers, unexposed (circles) and exposed (disks) to 150 ppb of acetic acid, all with an initial DP of 3000 and different initial pH values ranging 3–11. Due to equilibration with 150 ppb acetic acid their pH values shift as indicated by the curved arrows on the 0 years line. For papers with initial pH 3–5 and 9–11 the model predicts a negligible shift (the disks are surrounded by the circles), while the shift is predicted to be relevant for papers with initial pH in the range 6–8. Their DP will decrease in time (colored vertical arrows) and after 100 years of exposure their final DP is found on the 100 years curve (disks on the 100 years line). This final DP can be compared with the DP they would have reached if they would have aged at the same RH and temperature but without acetic acid exposure (circles on the 100 years line). The model predicts a negligible DP difference for samples with initial pH 3–5 and 9–11 and a DP difference of at most 2% for samples with initial pH in the range 6–8.

Predicted depolymerization in 100 years of papers with different initial pH, unexposed (circles) and exposed (disks) to 150 ppb of acetic acid. RH = 50% and T = 20 °C
Consistency with artificial aging data
Our understanding of the slow degradation processes of paper due to air pollutants would improve substantially if direct positive evidence from long term field studies would be available. Unfortunately, direct evidence from long term natural aging studies does not exist. Therefore we are forced to compare our predictions with accelerated aging results. Menart and co-workers [8] have published experimental data on the depolymerization of 4 types of papers exposed to 1000 ppb of acetic acid at 80 °C and 45% RH for 1 week. For one of the samples, a bleached pulp paper containing calcium-carbonate CaCo3, the authors measured both for the exposed and not exposed case an increase of the degree of polymerization, which of course can not be predicted with our model neither is explained by the authors. We have therefore limited our analysis below to the three samples actually showing loss of degree of polymerization. Table 1 reports along with the initial paper acidity pH0 and initial degree of polymerization DP0 of the samples, the final degree of polymerization measured experimentally and predicted by our model in the case of no exposure to acetic acid \(DP_{nat}^{exp}\) and \(DP_{nat}^{pre}\) and of exposure to acetic acid \(DP_{HAc}^{exp}\) and \(DP_{HAc}^{pre}\) under the conditions stated in the publication.
The relative change between the predicted and experimental data both in the case of natural de-polymerization and in the case of exposure to acetic acid ranges between 2 and 8%.
Discussion and conclusion
The good agreement between the predicted and experimental de-polymerization without exposure to acetic acid at high temperature gives confidence that the Zou model describes well the degradation of a wide range of papers. The good agreement between the predicted and experimental de-polymerization with exposure to acetic acid at high temperature gives confidence that a simple model for the composition of the paper and the following predicted pH shift upon acetic acid absorption are sufficient to predict the effect of this volatile acid on paper degradation. When applied at room temperature our model predicts an added de-polymerization due to 100 years of exposure to acetic acid at 150 ppb, which is the highest acetic acid level reported in the literature for a library storage, of the order of 2%. We believe that for real objects the added degradation will be smaller than this modeled value because diffusion of acetic acid in the bulk of the objects will be a rate limiting process, and because real papers should be expected to exhibit significant buffering action against pH change. The causal model developed here allows us to conclude that the impact of acetic acid and any other acid gases on paper degradation in a library or archive is limited and that neither the use of chemical filters to reduce acetic acid concentration in air nor the separate storage of acidic paper items are necessary preventive conservation measures in a library or archive. Although we consider comparative studies of actual collection materials and their environments to be essential for conservation science, we conclude that future field studies dedicated to find evidence of acid air pollutant damage are unlikely to succeed.
References
Daniel F, Flieder F, Leclerc F. The effects of pollution on deacidified paper. Restaur Int J Preserv Libr Arch Mater. 1990;11:179–207.
Havermans J. Effects of air pollutants on the accelerated ageing of cellulose-based materials. Restaur Int J Preserv Libr Arch Mater. 1995;16:209–33.
Begin P, Deschatelets S, Grattan D, Gurnagul N, Iraci J, Kaminska E, et al. The effect of air pollutants on paper stability. Restaur Int J Preserv Libr Arch Mater. 1999;20:1–21.
Dupont AL, Tetreault J. Cellulose degradation in an acetic acid environment. Stud Conserv. 2000;45:201–10.
Johansson A, Lennholm H. Influences of SO2 and O3 on the ageing of paper investigated by in situ diffuse reflectance FTIR and time-resolved trace gas analysis. Appl Surf Sci. 2000;161:163–9.
Zou X. During storage and shipping, nitrogen oxides can cause rapid yellowing and degradation of pulp and paper products. Pulp Paper-Canada. 2004;105:51–4.
Strlic M, Cigic IK, Mozir A, de Bruin G, Kolar J, Cassar M. The effect of volatile organic compounds and hypoxia on paper degradation. Polym Degrad Stab. 2010;96:608–15.
Menart E, De Bruin G, Strlic M. Dose-response functions for historic paper. Polym Degrad Stab. 2011;96:2029–39. https://doi.org/10.1016/j.polymdegradstab.2011.09.002.
Tetreault J, Dupont AL, Begin P, Paris S. The impact of volatile compounds released by paper cellulose degradation in ambient hygrothermal conditions. Polym Degrad Stab. 2013. https://doi.org/10.1016/j.polymdegradstab.2013.05.017.
Menart E, de Bruin G, Strlič M. Effects of NO2 and acetic acid on the stability of historic paper. Cellulose. 2014;21:3701–13. https://doi.org/10.1007/s10570-014-0374-4.
Becker M, Meyer F, Jeong M-J, Ahn K, Henniges U, Potthast A. The museum in a test tube—adding a third dimension to the evaluation of the impact of volatile organic acids on paper. Polym Degrad Stab. 2016;130:109–17. https://doi.org/10.1016/j.polymdegradstab.2016.05.026.
Buchbauer G, Jirovetz L, Wasicky M, Nikiforov A. On the odor of old books. J Pulp Pap Sci. 1995;21:J398–400.
Schieweck A, Lohrengel B, Siwinski N, Genning C, Salthammer T. Organic and inorganic pollutants in storage rooms of the Lower Saxony State Museum Hanover, Germany. Atmos Environ. 2005;39:6098–108. https://doi.org/10.1016/j.atmosenv.2005.06.047.
Ryhl-Svendsen M. Indoor air pollution in museums: prediction models and control strategies. Rev Conserv. 2006;51:27–41.
Nguyen Thi L. Indoor air pollution in the new building’s storage areas of the French National Gallery: Effects on the corrosion of copper and silver and on paper cellulose-1. First results. In: Indoor air quality 2006—7th international conference, held 15–16 April 2006, Braunschweig, Germany. 7th Indoor Air Quality Meeting. IAQ2006: 15–16 April 2006. Braunschweig. Germany; 2006. http://iaq.dk/iap/iaq2006/Nguyen_IAQ2006.pdf. Accessed 4 Oct 2018.
Fenech A, Strlic M, Cigic IK, Levart A, Gibson LT, de Bruin G, et al. Volatile aldehydes in libraries and archives. Atmos Environ. 2010;44:2067–73. https://doi.org/10.1016/j.atmosenv.2010.03.021.
Di Pietro G, Blueher A, Grossenbacher G. Monitoring indoor air pollution in the stacks of the Swiss National Library. In: Indoor air quality 2010—9th international conference, held 21–23 April 2010, Chalon-sur saone, France. 9th Indoor Air Quality Meeting. IAQ2010: 21–23 April 2010. Chalon-sur Saone. France; 2010. http://www.iaq.dk/iap/iaq2010/iaq2010_dipietro.pdf. Accessed 4 Oct 2018.
Di Pietro G, Ligterink F. The limited impact of acetic acid in libraries and archives. In:. Indoor air quality 2012—10th international conference, held 17–20 June 2012, London; 2012. http://www.iaq.dk/iap/iaq2012/iaq2012_Book_of_Abstracts_on-line.pdf. Accessed 4 Oct 2018.
Gibson LT, Ewlad-Ahmed A, Knight B, Horie V, Mitchell G, Robertson CJ. Measurement of volatile organic compounds emitted in libraries and archives: an inferential indicator of paper decay? Chem Cent J. 2012;6:42. https://doi.org/10.1186/1752-153X-6-42.
Krupinska B, Van Grieken R, De Wael K. Air quality monitoring in a museum for preventive conservation: results of a three-year study in the Plantin-Moretus Museum in Antwerp, Belgium. Microchem J. 2013;110:350–60. https://doi.org/10.1016/j.microc.2013.05.006.
Cincinelli A, Martellini T, Amore A, Dei L, Marrazza G, Carretti E, et al. Measurement of volatile organic compounds (vocs) in libraries and archives in florence (italy). Sci Total Environ. 2016;572:333–9.
Mašková L, Smolík J, Ďurovič M. Characterization of indoor air quality in different archives–Possible implications for books and manuscripts. Build Environ. 2017;120:77–84.
Di Pietro G, Ligterink F, Porck H, de Bruin G. Chemical air filtration in archives and libraries reconsidered. Stud Conserv. 2016;61:245–54. https://doi.org/10.1179/2047058415Y.0000000005.
Iversen T, Kolar J. Kvavedioxidis effekter pa papper (effects of nitrogen dioxide on paper), Report 5. FoU-Projektet for papperskonservering; 1991.
Williams EL, Grosjean D. Exposure of deacidified and untreated paper to ambient levels of sulfur dioxide and nitrogen dioxide: nature and yields of reaction. J Am Inst Conserv. 1992;31:199–212.
Gurnagul N, Zou XJ. The effect of atmospheric pollutants on paper permanence—a literature review. Tappi J. 1994;77:199–204.
Adelstein PZ, Zinn ED, Reilly JM. Effect of atmospheric pollution on paper stability. J Pulp Pap Sci. 2003;29:21–8.
Ryhl-Svendsen M. The influence of urban air pollution in archives. In: Bridgeland J, editor. Preprints of ICOM-CC 16th Triennial Conference Lisbon 19–23 September 2011; 2011.
Bülow A, Begin P, Carter H, Burns T. Migration of volatile compounds through stacked sheets of paper during accelerated ageing Part II: Variable temperature studies. Restaur Int J Preserv Libr Arch Mater. 2000;21:187–203.
Carter H, Begin P, Grattan D. Migration of volatile compounds through stacked sheets of paper during accelerated ageing part 1: acid migration at 90 degrees C. Restaur Int J Preserv Libr Arch Mater. 2000;21:77–84.
Lattuati-Derieux A, Bonnassies-Termes S, Lavedrine B. Identification of volatile organic compounds emitted by a naturally aged book using solid-phase microextraction/gas chromatography/mass spectrometry. J Chromatogr A. 2004;1026:9–18.
Strlic M, Cigic IK, Kolar J, de Bruin G, Pihlar B. Non-destructive evaluation of historical paper based on pH estimation from voc emissions. Sensors. 2007;7:3136–45. https://doi.org/10.1016/j.polymdegradstab.2010.12.017.
Dupont AL, Egasse C, Morin A, Vasseur F. Comprehensive characterisation of cellulose- and lignocellulose-degradation products in aged papers: capillary zone electrophoresis of low-molar mass organic acids, carbohydrates, and aromatic lignin derivatives. Carbohydr Polym. 2007;68:1–16. https://doi.org/10.1016/j.carbpol.2006.07.005.
Ramalho O, Dupont AL, Egasse C, Lattuati-Derieux A. Emission rates of volatile organic compounds from paper. EPreserv Sci. 2009;5:53–9.
Strlic M, Thomas J, Trafela T, Csefalvayova L, Cigic IK, Kolar J, et al. Material degradomics: on the smell of old books. Anal Chem. 2009;81:8617–22. https://doi.org/10.1021/ac9016049.
Lojewski T, Sawoszczuk T, Lagan JM, Zieba K, Baranski A, Lojewska J. Furfural as a marker of cellulose degradation. A quantitative approach. Appl Phys A Mater Sci Process. 2010;100:873–84. https://doi.org/10.1007/s00339-010-5663-7.
Raychaudhuri M, Brimblecombe P. Formaldehyde oxidation and lead corrosion. Stud Conserv. 2000;45:226–32. https://doi.org/10.2307/1506860.
Robinet L, Hall C, Eremin K, Fearn S, Tate J. Alteration of soda silicate glasses by organic pollutants in museums: mechanism and kinetics. J NonCryst Solids. 2009;355:1479–88. https://doi.org/10.1016/j.jnoncrysol.2009.05.011.
Robinet L, Eremin K, del Arco BC, Gibson LT. A raman spectroscopic study of pollution-induced glass deterioration. J Raman Spectrosc. 2004;35:662–70. https://doi.org/10.1002/jrs.1133.
Meyer F, Hansen D, Knjasev V, Volland G. The, “Schinkel’s legacy” project at the Kupferstichkabinett Berlin. Restaur Int J Preserv Libr Arch Mater. 2014;35:81–112.
Havermans J, de Feber M, Genuit WJ, van Velzen G. Emission of volatile organic compounds from paper objects affected with iron-gall ink corrosion. In: Bridgeland J, editor. Proceedings of the ICOM committee for conservation, 12th triennial meeting, Lyon; 1999, pp. 513–6.
Shahani C, Harrison G. Spontaneous formation of acids in the natural aging of paper. In: Daniels V, Donithorne A, Smith P, editors. Works of art on paper, books, documents and photographs. Techniques and conservation. Congress of the international institute for conservation, London: International Institute for Conservation of Historic; Artistic Works; 2002. pp. 189–92.
Lattuati-Derieux A, Bonnassies-Termes S, Lavedrine B. Characterisation of compounds emitted during natural and artificial ageing of a book Use of headspace-solid-phase micro extraction/gas chromatography/mass spectrometry. J Cult Herit. 2006;7:123–33. https://doi.org/10.1016/j.chroma.2003.11.069.
Curran K, Možir A, Underhill M, Gibson LT, Fearn T, Strlič M. Cross-infection effect of polymers of historic and heritage significance on the degradation of a cellulose reference test material. Polym Degrad Stab. 2014;107:294–306. https://doi.org/10.1016/j.polymdegradstab.2013.12.019.
Porck H, Smit W, van Heijst J. Research projects within the framework of a national mass conservation plan in The Netherlands. In: TAPPI paper preservation symposium. Washington, D.C.: TAPPI; 1988. pp. 74–80.
Michalski S. Guidelines for humidity and temperature in Canadian archives—CCI Technical bulletin 23. Canadian Conservation Institute; 2000.
Havermans J, Steemers T. Air pollution and its prevention. In: Kolar J, editor. Ageing and stabilisation of paper. Ljubljana: National; University Library; 2005. p. 165–79.
Horie C, editor. Advances in paper conservation research. British library, Collection care; 2009. http://www.bl.uk/aboutus/stratpolprog/ccare/events/advancesinpaper/advancesinpaper.html. Accessed July 2012 (No longer available online).
Weschler C, Shields HC. Chemical transformations of indoor air pollutants. In: Indoor air 1996. The 7th international conference on indoor air quality and climate; 1996. https://doi.org/10.1080/08940630.1989.10466650.
Hoetjer J. Introduction to a theoretical model for the splitting of formaldehyde from composition board. Delfzijil: Methanol Chemie Nederland; 1978.
Myers G, Nagaoka M. Emission of formaldehyde by particleboard: effect of ventilation rate and loading on air-contamination levels. For Prod J. 1981;31:39–44.
Little JC, Hodgson AT, Gadgil AJ. Modeling emissions of volatile organic compounds from new carpets. Atmos Environ. 1994;28:227–34. https://doi.org/10.1016/1352-2310(94)90097-3.
Lee C-S, Haghighat F, Ghaly W. A study on voc source and sink behavior in porous building materials—analytical model development and assessment. Indoor Air. 2005;15:183–96. https://doi.org/10.1111/j.1600-0668.2005.00335.x.
Jablonsky M, Katuščák S, Holúbková S, Hroboňová K, Lehotay J. The effect of acetic and formic acid formation during accelerated ageing on embrittlement of newsprint paper. Restaur Int J Preserv Libr Arch Mater. 2011;32:318–47.
Baranski A, Lagan JM, Lojewski T. Acid- catalysed degradation. In: Strlic M, Kolar J, editors. Ageing and stabilisation of paper. Ljubljana: National; University Library; 2005. p. 93–109.
Hol R, Voogt L. Bedreigd papierbezit in beeld: Schade-inventariserend onderzoek van archief- en bibliotheekmateriaal van na 1800 bij het algemeen rijksarchief en de koninklijke bibliotheek. Coördinatiepunt Nationaal Conserveringsbeleid; 1991.
Pedersoli JL Jr, Ligterink FJ, van Bommel M. Non-destructive determination of acetic acid and furfural in books by solid-phase micro-extraction (spme) and gas chromatography-mass spectrometry (gc/ms). Restaur Int J Preserv Libr Arch Mater. 2011;32:110–34. https://doi.org/10.1515/rest.2011.007.
Zou X, Gurnagul N. The role of lignin in the mechanical permanence of paper.2. Effect of acid groups. J Wood Chem Technol. 1995;15:247–62.
Bigourdan J, Adelstein P, Reilly J. Use of micro-environments for the preservation of cellulose triacetate photographic film. J Imaging Sci Technol. 1998;42:155–62.
Servant J, Kouadio G, Cros B, Delmas R. Carboxylic monoacids in the air of Mayombe Forest (Congo): role of the forest as a source or sink. J Atmos Chem. 1991;12:367–80. https://doi.org/10.1007/BF00114774.
Browning BL. Determination of moisture. In: Analysis of paper, 2nd edn, 270 Madison Avenue, New-York 10016: Marcel Dekker, Inc.; 1977. pp. 41–4.
Koljonen K, Mustranta A, Stenius P. Surface characterisation of mechanical pulps by polyelectrolyte adsorption. Nord Pulp Pap Res J. 2004;19:495–505.
TAPPI. Hydrogen ion concentration (pH) of paper extracts (cold extraction method), T 509 om-11. In: TAPPI test methods. Technical Association of the Pulp and Paper Industry; 2011.
Zou X, Gurnagul N, Uesaka T, Bouchard J. Accelerated aging of papers of pure cellulose—mechanism of cellulose degradation and paper embrittlement. Polym Degrad Stab. 1994;43:393–402.
Atkins P. Chemical equilibrium—the complete pH curve. In: Atkins P, editor. Physical chemistry, 5th edn. Oxford: Oxford University Press; 1994. p. 298–304.
Zou X, Uesaka T, Gurnagul N. Prediction of paper permanence by accelerated aging I. Kinetic analysis of the aging process. Cellulose. 1996;3:243–67.
Zou X, Uesaka T, Gurnagul N. Prediction of paper permanence by accelerated aging II. Comparison of predictions with natural aging results. Cellulose. 1996;3:269–79.
Baranski A, Begin P, Lagan JM, Lojewski T, Sawoszczuk T. Application of the Zou, Uesaka and Gurnagul model to the degradation of papers of various origins. J Pulp Pap Sci. 2006;32:238–44.
Ekenstam A. Behaviour of cellulose in solutions of mineral acids. Part II. A kinetic study of cellulose degradation in acid solutions. Berichte Der Deutschen Chemischen Gesselschaft. 1936;69:553–9.
Waller RR. Cultural property risk analysis model: development and application to preventive conservation at the canadian museum of nature. Goeteborg: Acta Universitatis Gothoburgensis; 2003.
Michalski S. Running a museum: a practical handbook. In: Boylan P, editor. ICOM-International Council of Museums; 2004. p. 51–90. http://unesdoc.unesco.org/images/0014/001410/141067e.pdf. Accessed Oct 2018.
Hoetjer J, Koerts F. A model for formaldehyde release from particleboard. In: Formaldehyde release from wood products (acs Symposium series, vol. 316), ACS Publications; 1986.
Weschler CJ, Shields HC, Naik DV. Indoor ozone exposures. Japca. 1989;39:1562–8.
Crank J. Mathematics of diffusion. Oxford: Oxford University Press; 1956.
Authors’ contributions
Both authors contributed to developing the model and finalizing the manuscript. Both authors read and approved the final manuscript.
Authors’ information
Frank Ligterink is senior researcher at the Rijkserfgoedlaboratorium of the Cultural Heritage Agency of the Netherlands. Giovanna Di Pietro is senior lecturer at the Department of Conservation and Restoration of the Bern University of Applied Sciences.
Competing interests
The authors declare that they have no competing interests.
Funding
This work has been funded by the Swiss National Foundation, Project 13DPD3_132247 and by Metamorfoze, the Dutch National Programme for the Preservation of Paper Heritage, Project 2010-37.
Publisher’s Note
Springer Nature remains neutral with regard to jurisdictional claims in published maps and institutional affiliations.
Author information
Authors and Affiliations
Corresponding author
Appendices
Appendices
1 Unified emission model
Although diffusion, evaporation, convection and equilibration processes are understood to fundamentally govern the transport physics of volatiles in materials and their environment, the full integration of these laws into predictive models is mathematically difficult. As a practical alternative, empirical models have been developed [72, 73] to describe and predict the sorption behavior of volatiles. The common element in these models is the description of volatile/material interaction in terms of mass transfer coefficients. Volatile emission behavior of materials as observed in flow chamber experiments is well described by the Hoetjer equation. (In order to facilitate comparison with his publication we use the notation of [72] here).
This equation can be rewritten in a reciprocal form.
In standard test series, after waiting several hours, the stationary concentration of the volatile cg is measured in a chamber loaded with the emissive material with surface area A per chamber volume V while the air exchange rate N is set to a constant level. The observed pseudo steady-state concentration is found to be inverse proportional to the air exchange rate. The material emission behavior is then characterized by an equilibrium concentration ce found by extrapolating to zero the exchange air rate and by an the overall mass transfer coefficient kog found from the slope of the reciprocal form. It is often implicitly assumed that the transfer coefficient kog and equilibrium concentration ce thus obtained from short term chamber experiments are time independent material parameters that can be used to predict long term emission behavior. However, there is no justification for such an extrapolation. Below we will derive how both parameters depend on fundamental material properties and that these coefficients are time dependent. It will be shown that the Hoetjer equation can be explained by diffusion physics.
We will model the emitting material as a semi infinite coated solid with surface area A and coating permeance K placed in a well mixed chamber with volume V and air exchange rate N. Within the material a time dependent concentration profile C(x, t) will develop as a result of (1) diffusion within the material, (2) evaporation from the surface, (3) equilibration at the surface and convective transport into the chamber and (4) air exchange of the chamber. Diffusion of the volatile within the material is described by the diffusion law with diffusion coefficient D.
The appropriate boundary condition can be found by adapting a standard surface evaporation boundary condition (see [74]) to include the partition coefficient p describing the equilibrium at the the surface between solid and gas phase and equating the mass flow leaving the bulk material Φm with the mass flow through the coating Φc into the chamber with the mass flow leaving the chamber NVcg(t).
where K is the surface permeance. The last equation can be used to eliminate cg(t).
This then gives the expression for the boundary condition.
Further assuming a starting condition of a constant concentration level in the material
the solution is given by [74] for the semi-infinite medium with surface evaporation boundary condition.
where C0 is the concentration in the medium that would be in equilibrium with the remote atmosphere, in this case C0 = 0. The concentration C2 is the initial concentration in the solid. Now slightly rewriting the erfc() function gives
where the parameter h now reflects the adapted boundary condition.
By substituting solution (16) at x = 0 into (12) we obtain an expression for the chamber concentration cg(t) as a function of time.
It is interesting to compare this expression with the Hoetjer model by exploring the limiting behavior in different ways. In the limit of zero diffusion resistance (D → ∞), both the exponential and the error function in Eq. (18) reduce to unity, giving a simple time independent expression for the chamber concentration.
By equating the starting concentration C2/p with the Hoetjer equilibrium concentration ce and the surface permeance K with the Hoetjer mass transfer coefficient kog we see that this limiting expression corresponds to the familiar Hoetjer Eq. (8). The absence of time dependence is due to the fact that a semi-infinite medium was used for modeling.
Another comparison can be made by converting into the reciprocal form 1/cg(t) and developing into a Taylor expansion with respect exchange rate N.
The factor between brackets corresponds to the reciprocal mass transfer coefficient in the Hoetjer equation.
The two terms in this expression reflect how the experimentally observed overall mass transfer resistance 1/kog is the sum of the resistance of the coating 1/K and the internal diffusion resistance of the material. In case of low diffusion resistance (D → ∞) the transfer coefficient kog corresponds to a coating permeance K. In cases where internal diffusion resistance dominates, we see that the mass transfer coefficient is clearly time dependent.
It can be concluded that the mass transfer coefficient is not a true material constant, but a transient property whose value will depend on the actual concentration profile in a material.
2 Calculation of pH-shift
To model the pH-shift of paper in response to an uptake of a specific amount of acetic acid we assume the initial pH of paper to result from a single fully dissociated acid or base. Here below we will derive the formula for the pH-shift (Eq. 3 in the text) for alkaline papers, the equation for acid papers can be solved following the same line of reasoning. The paper is characterized by an initial hydronium ion concentration [H3O+]0 which is measured in the water extract by macerating 1 g of paper in 70 mL of a 0.1 M NaCl water solution [63, 64]. After addition of a given amount of acetic acid the hydronium ion concentration will change to a new value [H3O+] which is as well measured in the water extract.
This process is equivalent to titrating a volume VA of a weak acid at initial molar concentration A0 by adding a volume VB of a strong base at molar concentration B and is solved in standard textbooks [61], p. 299]:
The equation can in our case be further simplified taking into account that the volume of acetic acid VHAc added to the water extract and equivalent to a certain concentration in air cair is given by:
where cHAc,p (g cm−3) is the concentration of acetic acid in the paper, Mp is the mass of paper in the extract (1 g), dHAc is the density of acetic acid (1.049 g cm−3) and dp is the average density of paper (0.8 g cm−3). For concentrations of acetic acid in air ranging from 100 to 10,000 ppb this volume ranges from 7 × 10⁻⁶ to 7 × 10⁻⁴ mL and it is therefore negligible in comparison with the total volume of the water extract (70 mL). This implies that neither the concentration of the base nor the total volume of the extract change relevantly during the titration process and that therefore Eq. (23) can be written as:
where B (mol L−1) is the concentration of the base, CAc (mol L−1) is the concentration of acetic acid and kAc= 1.74 × 10⁻⁵ mol L−1 and kw= 1.0 × 10⁻¹⁴ mol2 L−2 are the dissociation constants of acetic acid and water. As the base is fully dissociated and its concentration does not change during the titration process, we can express its concentration as a function of the initial hydronium ion concentration [H3O+]0:
Substituting (26) in the modified titration formula (25) and solving for the concentration acetic acid CAc we obtain the implicit formula for the pH-shift (Eq. 3 in the text).
3 Acetic acid titration of paper extracts
The pH-shift behaviour of three rather different papers was characterized by measuring the pH of their extracts according to a modified cold extraction method [63, 64] while adding acetic acid. Measurements were done under constant stirring and nitrogen gas purging using a Metrohm 827 pH meter with a combined glass micro-electrode. Volumes of acetic acid prepared from a 0.1 M solution (Titrisol®, Merck) corresponding to gaseous concentrations ranging from 0 to 10,000 ppb were added to the paper extract using a micro-pipette and the pH was measured after an equilibration time of few minutes. Three papers of different composition and different initial pH were tested: a Canon Olé alkaline office paper, Whatman filter cellulose No. 1 and an historic wood pulp paper, dating 1908. Each measurement was repeated in duplicate. Figure 5 shows the averaged measurements together with the theoretically predicted pH shifts calculated with Eq. 3. In all cases the actual pH shift is much smaller than the predicted pH. This confirms that actual paper samples have a stronger buffering action and that the simplifications made in the development of the present model are worst case approximations.

pH shift of the extract of three papers upon adding acetic acid. Broken lines are experimental data while solid lines theoretical predictions based on Eq. 3 in the text
Rights and permissions
Open Access This article is distributed under the terms of the Creative Commons Attribution 4.0 International License (http://creativecommons.org/licenses/by/4.0/), which permits unrestricted use, distribution, and reproduction in any medium, provided you give appropriate credit to the original author(s) and the source, provide a link to the Creative Commons license, and indicate if changes were made. The Creative Commons Public Domain Dedication waiver (http://creativecommons.org/publicdomain/zero/1.0/) applies to the data made available in this article, unless otherwise stated.
About this article

Cite this article
Ligterink, F., Di Pietro, G. The limited impact of acetic acid in archives and libraries. Herit Sci 6, 59 (2018). https://doi.org/10.1186/s40494-018-0225-y
Received:
Accepted:
Published:
DOI: https://doi.org/10.1186/s40494-018-0225-y