- Research article
- Open access
- Published:
Study on microbubble of cellulose acetate microfilm of the Republic of China (AD 1912–1949) collected in the Second Historical Archives of China
Heritage Science volume 8, Article number: 29 (2020)
Abstract
The white spots known as microbubbles that are formed in cellulose acetate film, significantly affects the texture of the image. However, the formation of microbubbles and their corresponding microstructure are poorly understood. In this paper, cellulose acetate microfilm from the Republic of China (AD 1912–1949) collected in the Second Historical Archives of China was chosen as a prototype to investigate the causes of microbubble disease for the first time. A comparative study was conducted between the film samples with and without microbubbles. Herein, the microstructural analyses including optical and SEM microscopy were conducted. The crystals in the microbubbles proved to be triphenyl phosphate as identified by NMR spectroscopy and SEM–EDX. Comparative properties of the film substrate with and without microbubbles were measured by TG, XRD and FT-IR spectroscopy. The results show that formation of microbubbles was generally accompanied with the vinegar syndrome and was produced between the protective and emulsion layers with the different types of shapes along the closed structure (the diameter of ~ 0.1–2 mm). The formed microbubble was filled with plasticizer. Based on the above-mentioned results, the possible formation process of microbubble was proposed in the present study. The results can provide support for the cause of microbubbles and basis for the conservation of photographic films.
Introduction
Photographic films, the most important carriers of artistic information and archives, record some key historical events (e.g. economic, cultural, and lifestyle). They mainly include cellulose nitrates, cellulose acetates and polyester [1]. Cellulose acetate ester materials have been widely used in various fields all over the world for their ease of access and safety for about 100 years. In particular, it was used as a substrate for photographic film instead of the highly flammable cellulose nitrate [2]. However, cellulose acetate film can be affected by many diseases such as mildew, vinegar syndrome etc. which result from the materials properties and preservation environment [3,4,5,6,7]. White spotted disease is a special disease produced in the cellulose acetate film, often called “microbubble” disease, significantly affects the texture of image and the safety of film (Fig. 1).

Cellulose acetate microfilm of the 1946s collected in the Second Historical Archives of China: a The sample with microbubbles disease; b The sample without microbubbles disease
The deterioration processes effect on the stability of cellulose ester plastics has attracted significant attention [8,9,10,11]. In general, the remarkable character of cellulose acetate degradation is deacetylation, which is mainly expressed by the increase of acidity [12, 13]. The stability of the substrate will be greatly reduced with the increasing concentration of acetic acid [14,15,16]. In addition, the loss of plasticizer leads to a decrease of mechanical strength of materials and deformation during the degradation process, which results in embrittlement [17,18,19]. In terms of repair and protection, the film foundation of America has invested a lot of financial resources in supporting film protection projects and developing film protection guidelines, which provide the most basic theoretical knowledge of film protection [20, 21]. In contrast to the above-mentioned methods, digital restoration technology is a safe and reliable restoration method, which can obviously improve the quality of film images [22,23,24]. Our group has been engaged in the protection research of cellulose acetate film for many years, and some important achievements have been made in terms of scratches, mildew and comprehensive treatment of vinegar syndrome [25,26,27,28]. All the above milestone investigations provide fundamental insights and lay solid foundations for the prevention and control of film disease. Among these diseases, microbubbles are a special disease, produced in cellulose acetate film, significantly affecting the texture of the image. However, to the best of our knowledge, there are no previous studies about the cause of film microbubble disease. Furthermore, the repair method is limited to date. Therefore, in order to better preserve the film and to eliminate the negative impact of microbubbles, a sound understanding of the cause of microbubble formation is indispensable.
The purpose of this study is to explore the causes of microbubble disease and provide a scientific basis for better preservation of cellulose acetate film. Samples of cellulose acetate microfilm from the Republic of China (AD 1912–1949) collected in the Second Historical Archives of China, including film with and without microbubbles disease, were selected to study the causes of microbubble disease for the first time. The microstructural analyses were conducted on cellulose acetate microfilm samples by optical microscopy and SEM. The crystals in the microbubbles were extracted and purified, and their structure and composition were identified by NMR spectroscopy and SEM–EDX. Comparative properties of the film substrate with and without microbubbles have been tested by TG, XRD and FT-IR spectroscopy.
Materials and methods
Sample description
Cellulose acetate microfilms of the Republic of China (1946s) collected in the Second Historical Archives of China were selected in this study. These microfilms belong to cellulose acetate positive film and record some important China’s diplomacy events during the republic of China. They are very valuable cultural relics. Some regions of the microfilms produced white spots (microbubbles) disease and its distribution was uncertain. The disease was found throughout the film (Fig. 1a), while the other parts were not found to have such disease (Fig. 1b). In the present study, two rolls of microfilms with and without microbubbles were investigated. The sample with image information was selected when non-destructive testing was used (e.g. optical microscopy), whereas the sample without image information was selected at the edge of microfilms when the damaged testing was used (e.g. scanning electron microscope (SEM)).
Methods
Microscopic analysis
The shape of the microbubbles was observed using transmitted light under an optical microscope (XWY-VI Fiber analyzer). The film was placed in the microscope with the image layer facing up. The SEM images were obtained from the image layer: Two pieces of film with and without microbubbles (~ 5 × 5 mm2) which contain no image information were chosen at the edge of film and placed on a double sided sticky tape on aluminum SEM specimen holders. Several coupons were examined using a Hitachi SU3500 SEM. Analyses were performed at low vacuum (1–150 Pa), with an accelerating voltage of 5 kV. Magnification was 40 × . Cellulosic acetate microfilms with and without microbubbles were soaked in distilled water for 10 min, placed in the freeze-dryer for 24 h for routine freeze-drying, the morphology of microfilm image layer was observed by SEM. For the cellulosic acetate microfilms with microbubbles, it was cut in the middle microbubble using a scalpel. SEM images and elemental maps were generated with a HITACHI SU3500 SEM coupled with an AMETEK EDAX Octane Elite EDX System. Magnification was 150 × .
Hydrophilic test
-
(a)
Contact angle: The contact angle of the microfilm samples was measured by hanging drop method with video optical contact angle tester (Dataphysics-OCA20). The injection speed was 1 µL/s, the volume of the water droplet was 2 µL, five different positions on the image layer and substrate surface were tested and the average value was obtained.
-
(b)
Moisture content: This experiment adopted the standard method for determining the moisture content of film in the chemical industry HG/T 3558-1988 [29]. Place about 1 g of the microfilm sample in a pre-dried weighing bottle with constant weight (m1). Drying 3 h at 70 °C without cover into an oven, then cover and cool in a dryer to room temperature before weighing (m2). The calculation formula is as follows:
H1 NMR and C13 NMR
For crystals within the microbubble analysis, a methanol swab was wiped across the surface of the sample (area; 50 mm × 50 mm) until the entire residue had been removed. Cellulosic acetate microfilms with microbubbles were cut in the middle with a scalpel. The crystals were extracted and recrystallized using methanol, 13C and 1H NMR spectra were collected on a JEOL 400 MHz nuclear magnetic resonance spectrometer (Tokyo, Japan) operating at 400 MHz for protons and 100 MHz for carbon at room temperature.
Characterization of substrate microstructure
To investigate the substrate microstructures, the image layer of the microfilm samples was removed to obtain the substrate materials which were tested as follows:
- (a)
TG: Q600 thermal gravimetric analyzer (TG) was used to analyze the thermal stability of the sheet substrate material with and without microbubble disease. Samples of initial weight was 3 mg, nitrogen flow was 10 ml/min, the heating rate was 10 °C/min, temperature range was 40–600 °C.
- (b)
XRD: The samples were two small pieces of substrate materials (about 5 × 5 mm2). Rigaku D/max-iii powder X-ray diffractometer (XRD) was used to test the crystalline structure of substrate with and without microbubble disease. Test condition: Cu target Kα line was radiation source, lambda = 1.5418 Å, voltage was 40 kV, current was 30 mA, scanning speed was 8°/min, scanning range was 10°–40°.
- (c)
FT-IR spectroscopy: Fourier transform infrared spectrometer (FT-IR) was used to test the changes of substrate properties with and without microbubble disease. A Nicolet iS10 FT-IR spectrometer coupled with a diamond ATR module was used in the reflection mode to analyze the composition of the samples at room temperature and ambient humidity. The wave number ranged from 500 to 4000 cm−1 with a resolution of 4 cm−1, and the scan number was 64 times. The non-destructive analyses of the samples were performed, and they were placed on the surface of sample holder. In order to reduce the effect of carbon dioxide and water vapor on FT-IR spectra, a sample and background spectrum are ratioed to remove the background contributions.
pH test
The method of measuring the acidity of microfilm used by kodak was adopted [20]. The specific test methods are as follows: Weighing 1.0 g microfilm samples, together with the emulsion layer and all coatings are cut into small pieces of 25 mm, add 100 ml of distilled water, in 38 °C slowly stirring for 24 h, filter microfilm particles, test the solution pH value. Three samples were measured in parallel on the same microfilm, and the average value was taken.
Results and discussion
Microscopic analysis
Figure 2 depicts the status of microbubble disease of cellulose acetate microfilm. As shown in Fig. 2a, b, when examined under transmitted light, some microbubbles are black and irregular and covered part of the image and negatively affect the picture integrity. The phenomenon is attributed to the filled crystal inside the microbubble which blocks the transmission of light. The surface of the damaged microfilm has a bulged spherical morphology and the growth position is irregular (Fig. 2d) compared to the microfilm without disease (Fig. 2c). The microbubble has a diameter ranging from 0.1 to 2 mm with an enclosed structure, it is therefore difficult to repair using the conventional methods, and there are no published studies available about restoration of microbubble disease of cinematic microfilms to date.

Optical and SEM microscopy of microbubble disease of cellulose acetate microfilm: a Round ball-like shapes are more regular bubbles viewed with an optical microscope using transmitted light; b Irregular bubble shape viewed with an optical microscope using transmitted light; c SEM images of the microfilm without microbubbles; d SEM images of the microfilm with microbubbles
Image layer morphology
The morphology of microfilm image layer with and without microbubbles was further investigated using scanning electron microscopy (SEM). As can be seen from Fig. 3a, b, the microfilm image layer is continuous and smooth interface without microbubbles, whereas the interface appears discontinuous and rough in the presence of microbubbles, implying that the properties of gelatin in the microfilm image layer changed after the microbubble occurred.

SEM analysis obtained with secondary electrons of the cross section of the microfilm image layer a without microbubbles; b with microbubbles
Hydrophily
-
(a)
Contact angle: The surface wettability of microfilm was evaluated by measuring the contact angle. There was a significant difference between the hydrophilicity of the two types of cellulose acetate microfilms (Fig. 4). The contact angle of the substrate with microbubbles decreases from 90.6° to 42.1°, indicating a significant increase of hydrophilicity. This is due to the increase of hydrophilic functional groups in the degraded regions of the microfilm. A similar trend was also observed from the image layer. This phenomenon is attributed to the chain scission and ring opening of gelatin leading to further moisture ingress [30].
Fig. 4 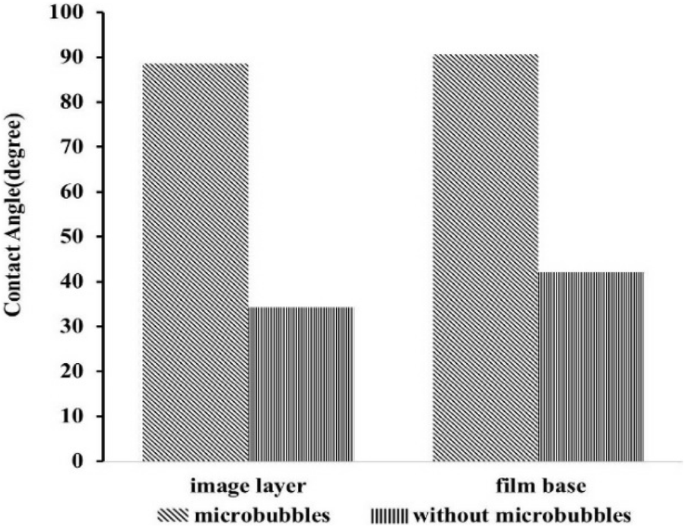
The contact angle of microfilm samples
-
(b)
Moisture content: In addition to measuring the moisture content and volatile components in microfilm, this test also investigates the dimensional stability of the microfilm substrate. From Table 1 it is seen that the moisture content increased from 1.72 to 4.14% in microbubble disease affected areas. The above results show that the microfilm with microbubbles are more hydrophilic owing to the production of the microbubbles, adsorbing water molecules from environment.
Table 1 The moisture content of the microfilm samples

Characterization of crystals in microbubble
-
(a)
SEM–EDX Fig. 5 presents an SEM image showing the morphology of microbubble section which is filled with crystals. In combination with Fig. 2, it can be seen that the microbubble is generated between the protective layer and the emulsion layer. A protective layer on the surface of the microfilm is a transparent gelatin film. As displayed in Fig. 5a, this layer is ~ 14 µm and the crystal thickness is ~ 61 µm. The morphology and composition of the crystals were characterized by SEM and EDX mapping as shown in Fig. 5c, d. The crystals are mostly tightly packed with some small gaps. The EDX spectrum shows that P is found other than C and O elements. This finding was also confirmed by the elemental analysis in a point of the surrounding area (Fig. 5e Point 1).
Fig. 5 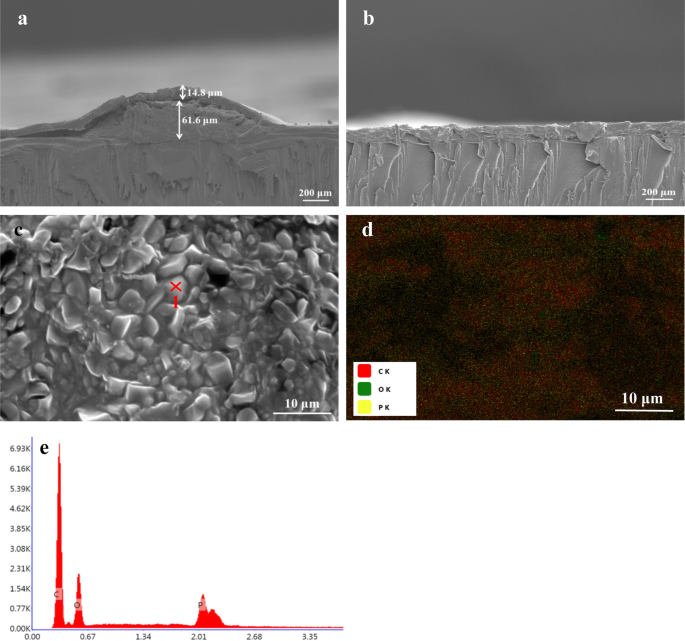
SEM image obtained with secondary electrons of the cross section of microfilm: a with microbubbles; b without microbubbles; c crystals in microbubbles indicating the one point where elemental analysis was performed; d the corresponding elemental mapping of P (yellow), C (red), O (green); e EDX spectrum collected at Point 1

1H NMR and 13C NMR spectra
In order to further identify the structure of crystals in microbubbles, the investigation by means of the hydrogen and carbon spectra was particularly useful. From the NMR spectra it is shown that the filled crystals in the microbubbles are triphenyl phosphate, and the NMR spectra is consistent with the previous literature result [26]. According to the 1H NMR spectra of purified crystals (Fig. 6a), the relative high chemical shift at 7.38–7.35 ppm is assigned to the H (c, c’, g, g’, k, k’); the signal at 7.24–7.19 ppm is ascribed to the H (b, b’, f, f’, j, j’, d, h, l); the signal at 4.87 and 3.31 ppm is ascribed to the Methanol-D4. The 13C NMR spectra of purified crystals (Fig. 6b) show 4 signals for 18 carbons. The peak with δC of 49.15 ppm is related with the carbon of Methanol-D4; the relative high chemical shift at 150.4 ppm is assigned to the C (a, e, i); the signal at 129.9 ppm is ascribed to the C (c, c’, g, g’, k, k’); the peak at 125.8 ppm is attributed to the C (d, h, l) and the peak at 119.8 ppm is assigned to the C (b, b’, f, f’, j, j’). Triphenyl phosphate is mainly used as a plasticizer added to enhance the flexibility of the sheet substrate [18]. Degradation of cellulose triacetate changes the substrate from hydrophobic to hydrophilic, the hydrophobic plasticizer precipitating generated from within the image layer, which forms a microbubble.

a1H-NMR of crystals; b13C-NMR of crystals
Characterization of substrate
-
(a)
Thermogravimetry (TG): Thermal analysis is an excellent tool for characterizing plastics. The thermal stability of the sample was measured by thermogravimetry, and the corresponding result is present in Fig. 7. The oxidation temperature of unaffected and affected substrate were ~ 260 and 340 °C, respectively. This result indicates that the thermal stability of the microfilm substrate material decreased after the microbubble was produced. This is because the molecular structure of substrate material is changed and the corresponding energy of pyrolysis is reduced [31]. It is concluded that the microbubble forms as the substrate deteriorates.
Fig. 7 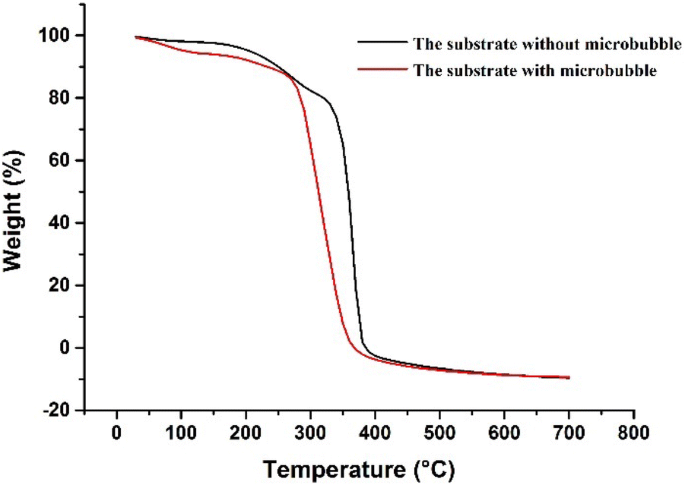
TG curves of microfilm substrate samples
-
(b)
X-ray diffraction (XRD): X-ray diffraction is the most direct method to determine the crystallinity and orientation degree of cellulose. The XRD pattern of unaffected and affected substrate occurred is presented in Fig. 8. XRD pattern of cellulose acetates exhibited peaks at 8.5° which corresponded to the randomness after acetylation of the cellulose. The observed peaks between 18.3° and 22.5°could be indexed as the packing of carbon atoms due to the Van der Waals forces [32]. The intensity of the amorphous peak of the substrate decreases after the microbubble disease occurred, indicating that the integrity of crystallization decreases after microbubble formation [33]. The original long chain structure of cellulose is broken into fragments.
Fig. 8 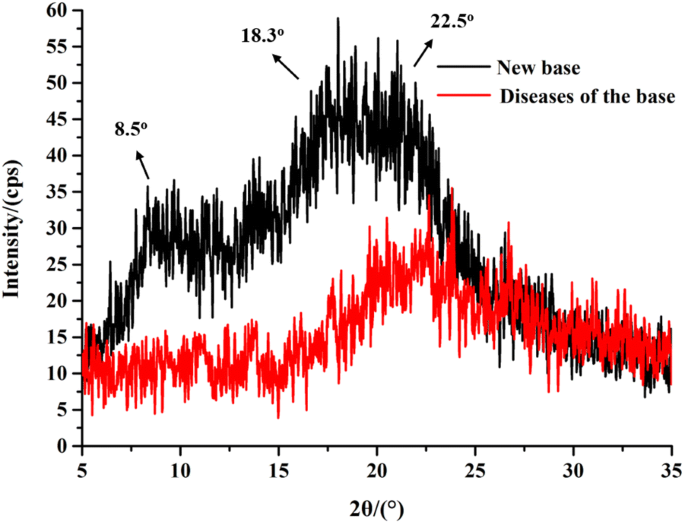
XRD curves of microfilm substrate samples
-
(c)
Fourier transform infrared (FT-IR) spectroscopy: Fig. 9 shows the FT-IR spectra of the substrate with and without microbubbles. Characteristic cellulose peaks appear in the fingerprint region from 850 ~ 1800 cm−1. The band appearing at 1037 cm−1 is due to asymmetric stretching of O–C–C bond attached to the carbonyl carbon [6]. The band located at 1213 cm−1 is the result of asymmetric stretching of C–C–O of the ester group. The band in the region of 1730 cm−1 is due to carbonyl stretch of the ester group. There is a weak spectral band at 2930 cm−1, which is caused by the stretching of the methyl and methylene CH moieties in the molecule [6].
Fig. 9 
FT-IR spectra of microfilm substrate samples


Comparing the FTIR spectrum of the substrate without the microbubbles with the unaffected sample there are a number of spectral differences. There is a band of strong intensity at ca. 3351 cm−1 attributed to O–H stretching vibration, while the intensity of the C=O band at ca. 1730 cm−1 is decreased. This result indicates a loss of acetate groups and an increase in the intensity O–H peak with the degeneration of materials, consistent with the typical properties of deacetylation [8].
pH test
The pH of microfilm without and with microbubble disease were measured and found to be 5.69 and 3.23, respectively, and the pungent smell could be smelled in the microfilm box, implying that the microfilm acidity increases with the production of acetic acid. This result is further supported by our FT-IR analysis that a loss of acetate group and a growth of –OH group in the substrate after the microbubble disease happened. The conclusion is in good agreement with the literature reporting that the generated acetic acid can act as a catalyst to accelerate the process of deacetylation [8].
On the basis of above discussion, it helps us realize that the microbubble disease is associated with vinegar syndrome. Vinegar syndrome is the most important factor affecting the deterioration of photographic microfilm. The possible process of microbubble production is shown in Fig. 10, which mainly include the following two aspects: (1) Microbubble Formation: The substrate properties are changed after the vinegar syndrome starts. Gelatin in the microfilm emulsion layer degrades in the presence of acetic acid and water. The acetic acid is released into the environment from one side of the substrate. (2) Plasticizer Filling: Previous studies have confirmed that the cellulose acetate film contains ~ 20–40% by weight of plasticizer [17,18,19]. The plasticizer is precipitated because the hydrophobicity of substrate becomes hydrophilicity in the dissociation of substrate. During the microbubble generation, the migration direction of plasticizer has two ways: (a) The microbubble fills with plasticizer when the plasticizer moves towards the image layer; (b) The plasticizer covers the surface of substrate when the plasticizer moves towards the substrate.

Schematic diagram of microbubble generation
Conclusion
Cellulose acetate microfilm of the Republic of China (1946s) collected in the Second Historical Archives of China were studied in this paper. A comparative study was conducted between microfilm samples with and without microbubbles. The main conclusions are summarized as follows:
- (1)
Microscopic studies were performed on a optical microscope and scanning electron microscope (SEM). Microbubbles are mainly produced between the protective layer and the emulsion layer and form different shapes and sizes. They are closed structures with diameters of 0.1–2 mm. The unaffected microfilm image layer has a continuous and smooth interface which becomes discontinuous and rough with the formation of microbubbles.
- (2)
The microbubble is filled with crystals. The microbubbles are filled with crystals identified by NMR spectroscopy and SEM–EDX as triphenyl phosphate, which is a plasticizer added to enhance the flexibility of the substrate.
- (3)
Contact angle and moisture content test results indicated that the hydrophilic properties of the microfilm with microbubbles increased significantly than those of the unaffected samples.
- (4)
Through TG, XRD and FT-IR spectroscopy comparative tests, it was found that the microfilm substrate aged and deteriorated after the occurrence of microbubble disease.
The above-mentioned results are consistent with the presence of vinegar syndrome. Therefore, it is proposed that the microbubble film disease is accompanied by the production of the vinegar syndrome. This work provides fundamental insights into the presence of microbubbles serving as another indicator to evaluate the production of the vinegar syndrome in the cellulose acetate film. Improving storage is the single most important step that institutions can take to protect their film collections. Temperature and moisture are the two key factors affecting the rate of film deterioration. The Image Permanence Institute has produced the IPI Media Storage Quick Reference, a publication bringing together information on storing film. Consult the IPI Web site (www.rit.edu/) and the IPI Media Storage Quick Reference for more detailed information.
Availability of data and materials
The datasets analyzed during the current study are available from the corresponding author on reasonable request.
Abbreviations
- SEM:
-
Scanning electron microscope
- TG:
-
Thermal gravimetric
- XRD:
-
X-ray diffraction
- FT-IR:
-
Fourier transform infrared
References
Shashoua Y. Inhibiting the inevitable: current approaches to slowing the deterioration of plastics. Macromol Symp. 2006;238:67–77.
Adelstein PZ, Reilly JM, Nishimura DW, Erbland CJ, Bigourdan JL. Stability of cellulose ester substrate photographic film: part V—Recent findings. SMPTE J. 1995;104:439–47.
Mazurek J, Laganà A, Dion V, Etyemez S, Carta C, Schilling MR. Investigation of cellulose nitrate and cellulose acetate plastics in museum collections using ion chromatography and size exclusion chromatography. J Cultur Herit. 2019;35:263–70.
Abrusci C, Marquina D, Santos A, Del Amo A, Corrales T. Biodeterioration of cinematographic cellulose triacetate by Sphingomonas paucimobilis using indirect impedance and chemiluminescence techniques. Int Biodeterior Biodegrad. 2009;2:759–64.
Zhou YJ, Li YH. Discussion about the hazards and preventive measures of cine film acetic acid syndrome. Photogr Sci Photochem. 2011;6:464–70 (in Chinese).
Schilling M, Bouchard M, Khanjian H, Learner T, Phenix A, Rivenc R. Application of chemical and thermal analysis methods for studying cellulose ester plastics. Acc Chem Res. 2010;43:888–96.
Shashoua Y. Conservation of plastics: materials science, degradation and preservation. J Am Inst Conserv. 2010;49:55–7.
Littlejohn D, Pethrick RA, Quye A, Ballany JM. Investigation of the degradation of cellulose acetate museum artefacts. Polym Degrad Stab. 2013;98:416–24.
Sutherland K, Schwarzinger C, Price BA. The application of pyrolysis gas chromatography mass spectrometry for the identification of degraded early plastics in a sculpture by Naum Gabo. J Anal Appl Pyrol. 2011;94:202–8.
Quye A, Littlejohn D, Pethrick RA, Stewart RA. Investigation of inherent degradation in cellulose nitrate museum artefacts. Polym Stab Degrad. 2011;96:369–76.
Tsang JS, Madden O, Coughlin M, Maiorana A, Watson J, Little NC, Speakman RJ. Degradation of ‘Lumarith’ cellulose acetate examination and chemical analysis of a salesman’s sample kit. Stud Conserv. 2009;54:90–105.
Blank S, Quye A, Williamson C. Plastics: collecting and conserving. J Am Inst Conserv. 2002;40:271–6.
Edwards HGM, Johnson AF, Lewis IR, Turner P. Raman-spectroscopic studies of pedigree doll disease. Polym Degrad Stab. 1993;41:257–64.
Vidéki B, Klébert S, Pukánszky B. Grafting of caprolacton to cellulose acetate by reactive processing. Eur Polym J. 2005;41:1699–707.
Olaru N, Andriescu A, Olaru L. On the hydrolysis of cellulose acetate in toluene/acetic acid/water system. Eur Polym J. 2001;37:865–7.
Mayes HB, Broadbelt LJ. Unraveling the reactions that unravel cellulose. J Phys Chem A. 2012;116:7098–106.
Ayuk JE, Mathew AP, Oksman K. The effect of plasticizer and cellulose nanowhisker content on the dispersion and properties of cellulose acetate butyrate nanocomposites. J Appl Polym Sci. 2009;114:2723–30.
Richardson E, Giachet MT, Schilling M, Learner T. Assessing the physical stability of archival cellulose acetate films by monitoring plasticizer loss. Polym Degrad Stab. 2014;107:231–6.
Quintana R, Persenaire O, Lemmouchi Y, Sampson J, Martin S, Bonnaud L, Dubois P. Enhancement of cellulose acetate degradation under accelerated weathering by plasticization with eco-friendly plasticizers. Polym Degrad Stab. 2013;98:1556–62.
National Film Preservation Foundation Contributors. The Film Preservation Guide: the basics for archives, libraries, and museums. San Francisco: National Film Preservation Foundation; 2004.
Melville A, Simmon S. Film Preservation 1993: a Study of the Current State of American Film Preservation. New York: Library of Congress; 1993.
Sadhar SI, Rajagopalan AN. Restoration of scanned photographic images. Signal Process. 2006;5:1035–48.
Takahiro Y, Tatsuya F, Mitsuru N, Daisuke S, Kazuhiro S, Tetsuro F. Superhigh-definition digital cinema distribution system with 8-million-pixel resolution. Syst Comput Japan. 2006;4:35–44.
Kokaram A. Detection and removal of line dcratches in degraded motion picture sequences. Signal Process. 1996;1:5–8.
Qi YP, Zhou YJ, Zhang J, Huo YJ, Shen SK, Li YH. Research on the influence of acetic acid syndrome on the property of film substrate, Journal of Shaanxi Normal University (Natural Science Edition). 2017; 2: 63–67. (in Chinese).
Zhang CC, Zhang FS. Recovery of triphenyl phosphate from waste printed circuit boards by solvothermal process. Chem Eng J. 2014;240:10–5.
Zhou YJ, Li YH, He Y, Qin XL, Zuo CX. Discussion on storage conditions of cellulose acetate cine-film. Arch Sci Study. 2010;4:66–9 (in Chinese).
Jia ZH, Li YH, Shi MR, Xie LN, Zhou YJ. The effect of temperature and humidity on the physical properties of cellulose acetate film. Imaging Sci Photochem. 2017;6:797–807 (in Chinese).
Fang ZJ. Method for determination of moisture content of film. Photosensit Mater. 1988;3:37–9.
Cabiac A, Guillon E, Chambon F, Pinel C, Rataboul F, Essayem N. Cellulose reactivity and glycosidic bond cleavage in aqueous phase by catalytic and noncatalytic transformations. Appl Catal A. 2011;402:1–10.
Gauthier E, Laycock B, Cuoq FJJM, Halley PJ, George KA. Correlation between chain microstructural changes and embrittlement of LLDPE-substrated films during photo- and thermo-oxidative degradation. Polym Degrad Stab. 2013;98:425–35.
Neto JCDA, Almeida ACD, Machado CDS, Coelho DO, Mourad N, Teixeira NS, Pereira GJ, Morandim-Giannetti ADA. Attainment of cellulose acetate from coir fiber submitted to pretreatment with IL n-butylammonium acetate. Iran Polym J. 2019;28:425–33.
Huang M, Li XG. Thermal degradation of cellulose and cellulose esters. J Appl Polym Sci. 1998;2:293–304.
Acknowledgements
This work was supported by the Fundamental Research Funds for the Central Universities (Grant Nos. GK1301031683 and 1301030147) and National Natural Science Foundation of China (Grant No. 51403121).
Funding
The research is financially supported by Fundamental Research Funds for the Central Universities (Grant Nos. GK1301031683 and 1301030147) and National Natural Science Foundation of China (Grant No. 51403121).
Author information
Authors and Affiliations
Contributions
YQ, YZ, JL and HX performed the measurements and contributed to the SEM, XRD, TG, NMR and FT-IR Data analysis; ZJ wrote most of the initial versions of the text and figures. All authors contributed to research strategy, the discussion and interpretation of the results and to the final form of the text and figures. All authors read and approved the final manuscript.
Corresponding authors
Ethics declarations
Competing interests
The authors declare that they have no conflict of interest.
Additional information
Publisher's Note
Springer Nature remains neutral with regard to jurisdictional claims in published maps and institutional affiliations.
Rights and permissions
Open Access This article is licensed under a Creative Commons Attribution 4.0 International License, which permits use, sharing, adaptation, distribution and reproduction in any medium or format, as long as you give appropriate credit to the original author(s) and the source, provide a link to the Creative Commons licence, and indicate if changes were made. The images or other third party material in this article are included in the article's Creative Commons licence, unless indicated otherwise in a credit line to the material. If material is not included in the article's Creative Commons licence and your intended use is not permitted by statutory regulation or exceeds the permitted use, you will need to obtain permission directly from the copyright holder. To view a copy of this licence, visit http://creativecommons.org/licenses/by/4.0/. The Creative Commons Public Domain Dedication waiver (http://creativecommons.org/publicdomain/zero/1.0/) applies to the data made available in this article, unless otherwise stated in a credit line to the data.
About this article

Cite this article
Jia, Z., Li, Y., Qi, Y. et al. Study on microbubble of cellulose acetate microfilm of the Republic of China (AD 1912–1949) collected in the Second Historical Archives of China. Herit Sci 8, 29 (2020). https://doi.org/10.1186/s40494-020-00374-3
Received:
Accepted:
Published:
DOI: https://doi.org/10.1186/s40494-020-00374-3