- Research article
- Open access
- Published:
Dynasty recognition algorithm of an adaptive enhancement capsule network for ancient mural images
Heritage Science volume 9, Article number: 141 (2021)
Abstract
In view of the polysemy of mural images and the style difference among mural images painted in different dynasties as well as the high energy costs of the traditional manual dynasty classification method, which resorts to mural texts and historical documents, this study proposed an adaptive enhancement capsule network (AECN) for automatic dynasty identification of mural images. Based on the original capsule network, we introduced a preconvolution structure to extract the high-level features of the mural images from Mogao Grottoes, such as color and texture. Then, we added an even activation operation to the layers of the network to enhance the fitting performance of the model. Finally, we performed adaptive modifications on the capsule network to increase the gradient smoothness of the model, based on which to optimize the model and thus to increase its classification precision. With the self-constructed DH1926 data set as the study subject, the proposed model achieved an accuracy of 84.44%, an average precision of 82.36%, an average recall rate of 83.75% and a comprehensive assessment score F1 of 83.96%. Compared with modified convolution neural networks and the original capsule network, the model proposed in study increased all the considered indices by more than 3%. It has a satisfactory fitting performance, which can extract the rich features of mural images at multiple levels and well express their semantic information. Furthermore, it has a higher accuracy and better robustness in the classification of the Mogao Grottoes murals, and therefore is of certain application values and research significance.
Introduction
As the most primitive form of paintings, murals have become the most precious human cultural heritage. Mogao Grottoes, as the largest and best preserved mural art treasure house, continued through ten dynasties in China’s history, and the murals produced in different dynasties exhibit different features in terms of human characters, colors and painting characteristics. To conduct deep research on these content-rich murals, a key step is to identify the dynasties they are subject to.
Digital technology has been extensively applied in research on traditional art works [1–3], such as the employment of machine learning and input vector for the classification of landscape painting images [4] and the application of attention-paid long-short term memory neural network-based multi-instance learning algorithm in Chinese painting image classification [5]. Currently, most of the existing methods for mural automatic classification are based on computer vision, and some typical examples include the semantic retrieval model based on the relevance between the compositions of ancient murals and their semantics [6], the grouped multi-instance method [7] and the overall contour-based similarity measure method [8]. Although all these abovementioned traditional mural classification methods achieve certain effect when used for mural classification, they can only extract the low-level features of murals. Due to the subjectivity and diversity of mural images, none of them can fully extract the high-level features of murals, such as texture and color features.
Recent years has witnessed some meaningful explorations into the application of deep learning in the field of mural dynasty classification [9, 10]. Zou et al. [9] selected 660 mural images under the same subject of Flying-Asparas. However, the selection of the mural images from the same category constitutes an overt limitation of their study. Although both Zou et al. [9] and Li et al. [10] utilized convolutional neural network (CNN) for mural image classification, CNN failed to effectively extract class features such as hue and texture when faced with certain entities (e.g., people and buildings) in mural images.
Capsule network can perform feature detection according to the feature information extracted from a mural image and then understand the image. Capsule network was originally proposed by the “father of deep learning” Geoffrey Hinton [11]. The outstanding features of capsule network lie in that it can well express the color and texture features of images and perform image classification based on the three-dimensional features of the image as well as the features owned by the images themselves. Capsule network has been applied in identifying and classifying hyperspectral images [12], fine-grained images [13]. Fashion-MNIST and CIFAR-10 datasets [14] and medical images [15], and has obtained certain achievements. In recent years, modified capsule network models have been frequently applied in the classification of various types of images, such as breast cancer images [16], brain tissue images and tumor images [17], corneal images with and without noise [18], hyperspectral images [19], Google screenshot images of street view, houses and digital numbers [20] and texture images [21]. Capsule network exhibits strong robustness and satisfactory performance in the task of image classification, which can accomplish mural image classification according to the diversity, subjective oneness, polysemy and texture complexity of the images. The capsules in the network contain rich feature information; the dynamic routing between capsules enables the network to dynamically learn the semantic information contained in the image, and in the meantime, it can retain the semantic information during the training process of the entire network. Because of these merits, capsule network can effectively capture the texture feature and color gradient changes of the image and overcomes the problem of non-uniform illumination. It realizes the fitting of the color, texture and artistic features of mural images in the feature capsule layer to finally determine the dynasties of the images and realize their dynasty-based classification. Therefore, capsule network is suitable for the feature extraction of mural images.
However, in original capsule network, the first section is a single-layer convolution layer. Due to a simple structure, this layer cannot fully extract the features of mural images with complex colors and textures. Therefore, in this study, we proposed an adaptive enhancement capsule network (AECN). In the proposed network, we increased the number of the convolution layers based on the original capsule network to extract the high-level features of images. To prevent the overfitting problem, we activated the added convolution layers evenly. In addition, we enhanced the adaptability of the proposed model to improve its final classification precision. These improvements enable the network to deeply extract the detailed features of mural images, such as color, texture and painting styles (e.g., methods for character line running, color matching and character outline representation), based on a small number of mural datasets, thereby realizing a higher accuracy and a stronger robustness in image classification.
Methodology
Related theories
Capsule network takes full advantage of the spatial hierarchy of feature maps on the basis of the CNN. The basic principle of the capsule network is as follows. The feature capsule layer extracts the image features from the original image to form capsule feature maps, and then, the category capsule layer maps each feature in the feature capsule layer into the corresponding class. The parameters of the capsules in the network are updated via a dynamic routing algorithm. During the routing process, each capsule is a vector, which serves as an input stimulus. Based on capsule calculation, the output capsule layer can be obtained. Each capsule retains the feature of spatial hierarchy, which is transferred to the next category capsule layer for further processing. During the whole process, the mapping between capsule layers is realized via the dynamic routing algorithm.
The capsule ui that forms the capsule feature map in the feature capsule layer is multiplied with a weight matrix to obtain a temporary feature capsule tji, and the calculation formula is as follows:
where i represents the serial number of the feature in the feature capsule layer and j represents the serial number of certain category processing of the category capsule layer.
The category capsule Sj to be output is obtained by multiplying the temporary feature capsule tji with the weight cji, and the calculation formula is as follows:
The output part of the capsule is the output category capsule Vj which is obtained after Sj is standardized with the squashing compression function. The calculation formula is as follows:
Capsule network achieves a better result by updating the value of cji, and cji is updated via the weight probability bij, which is calculated as follows:
where bij is calculated as follows:
Lastly, the length of Vj, i.e., the probability of the j category, is calculated. Capsule network uses Margin loss as the loss function to obtain the loss L, whose calculation is as follows:
where n is the number of categories, Rj is the value of the one-hot type of labels, 1 and 0 represents a right category and a wrong category, respectively, m+ and m− are the self-defined qualified upper threshold and unqualified lower threshold, respectively, and vj is the average obtained after subtraction of the corresponding thresholds from the predicted results during the training process of the entire network followed by squaring (it is equivalent to the error of the Euclidean distance between the predicted result and the threshold).
Capsule network has a satisfactory classification effect on handwriting digit databases, such as MNIST. Compared with handwriting digit images, however, mural images possess richer colors, more noticeable color gradient variations and more complex texture features. Furthermore, quite a large number of grotto mural images bear great similarities with paintings in both content and text. For these reasons, the direct use of the original capsule network will fail to extract the deep, abundant features of mural images, thereby causing an unsatisfactory classification precision. To improve the dynasty recognition accuracy for the mural images of Mogao Grottoes and to achieve better retrieval, recognition and classification of the mural images produced in different historical periods, we proposed the current AECN.
AECN
Overall structure
The overall structure of the AECN proposed in this study is shown Fig. 1.

Overall structure of the adaptive enhancement capsule network proposed in this study
In the AECN, three layers of convolution are used to extract the two-dimensional features of the input image. These features are then conveyed to the feature capsule layer to form high dimensional feature capsules. Lastly, these capsules are mapped onto the classification outcomes via the dynamic routing algorithm of the category capsule layer. The running time of the model is 1.5 h, and seven hidden layers are used.
In Fig. 1, “conv” represents a convolution layer. Following it, the first parameter is the size of the convolution kernel, the second is the step of convolution and the third is the output layers of convolution. For instance, "conv-3-1-64" means that a feature map experiences a convolution operation by a kernel with a size of 3 × 3 and a step of 2 to obtain a 64-layer feature map.
“PrimaryCaps” are the category capsule layers. The function of these layers is to abstract the features of the input image through one convolution operation and then seal these features into capsules. For instance, in “PrimaryCaps(conv-32-16-256)(8-32)”, the convolution operation is performed with a 32-size, 16-step kernel to obtain a 256-layer feature map, and the feature map is packaged into a 32-layer capsule feature map whose content length is 8.
“DigitCaps” are the category capsule layers. Each layer contains 10 categories capsules, whose function is to map the feature capsules in the feature capsule layer onto the category capsules. For instance, in “DigitCaps(32-6)(8-16)16-6”, for each input vector, the input feature capsule layer is transformed into 6 16-dimensional feature capsules via a capsule weight matrix whose floating point number is 8 × 16 and whose size is 32 × 6 to represent the vector length of a certain category capsule, i.e., the confidence level of the target belong to a certain category.
The AECN adopts the Adam optimizer for the parameter optimization of the entire model, with a learning rate of 1 × 10⁻⁹. The learning rate is updated using the gradient first- and second-order moments, which does not just increase the convergence rate of the model but obtains the optimal solution in the meantime as well. Adam optimizers integrate the merits of both the Adagrad optimizer and the RMSProp optimizer, and have the advantages of a high calculation efficiency and low memory usage. In actual practice, they can satisfactorily process noise samples and have certain annealing effect.
Improvements
Capsule network acquires the relationships between features through capsule packaging of the extracted image features in the feature capsule layer, and then utilizes a dynamic routing algorithm to fit these relationships to construct the correspondence between classification labels. Therefore, how to acquire the abundant feature and semantic information contained in the mural and how to prevent the occurrence of semantic gaps are the critical issues of capsule network in identifying the dynasties of ancient mural images.
In contrast, by increasing multiple preconvolution layers for feature extraction at a deeper level, the proposed AECN can fully acquire the abundant feature and semantic information contained in the mural. The even activation for the convolution layers in the proposed AECN can prevent the problem of gradient disappearance during back propagation, thereby improving the fitting performance of the model. Additionally, the parameter modifications of the feature capsule layer of the original capsule network can increase the adaptability of the network, and the use of an adaptive optimization algorithm can realize the optimization of the parameters of the entire preconvolution layer to increase the smoothness of the model.
-
(1)
Introducing preconvolution layers to enhance the expressiveness of the network. The convolution section of the original capsule network is no more than a convolution operation on the image for feature extraction. For ancient mural images with complex features (e.g., 224 × 224 × 3), such an operation cannot extract high-level, abstract features (these features can reflect the features of the target), which leads to a poor dynasty-based classification effect. Therefore, to obtain richer, more detailed features such as color and painting styles, more convolution layers are required. In this study, we used three consecutive convolution layers to replace the original single convolution layer in the original capsule network to realize high-level, abstract feature extraction. The preconvolution section of the AECN is composed of three convolution layers, which is shown in Fig. 2.
Fig. 2 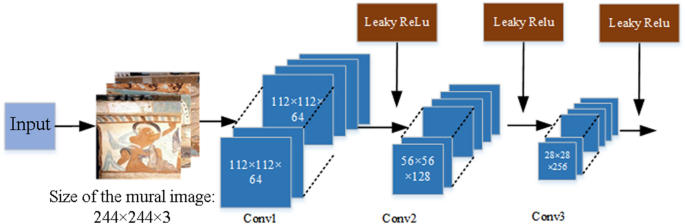
Structure of the preconvolution part
The inputs of the proposed ACEN are 224 × 244 × 3-sized images. For the first convolution operation, 64 3 × 3-sized kernels are used. The convolution operation is moved on the original image, and both the horizontal and vertical steps are 2. Edge filling is performed using the “SAME” method. As the first convolution layer adopts 64 kernels, the output is a 64-layer feature map. In the second convolution layer, 128 kernels that are the same as those in the first layer are used, and the output is a 128-layer feature map, i.e., 56 × 56 × 128. The third layer involves 256 3 × 3-sized kernels, and the output is 28 × 28 × 256.
Through three preconvolution layers of small kernels with a small operation step, the original image is pre-processed into multiple two-dimensional features with better abstractness. These features are prepared to form later feature capsules with higher expressiveness.
-
(2)
Adopting even activation for the convolution layers to improve their fitting performance. To prevent the problem of gradient disappearance of the preconvolution part during back propagation, a suitable activation function is required to sort the features that are to be propagated to the next layer. To endow the proposed model with better fitting performance and a higher convergence rate, the activation function in the original network is replaced, and each of the convolution layers with newly-added preconvolution is activated.
In the ACEN, a Leaky ReLU activation function is used following each of the convolution layer. As a variant of the ReLU function, Leaky ReLU activation function is an unsaturated activation function. This function overcomes the phenomenon of negative neuron silencing, and therefore can accelerate the convergence of the model to a certain degree and prevent gradient diffusion. However, it allows gradient learning and thus solves the problem that neurons no longer learn after the ReLU function enters a negative interval, and thus possesses the merits of saturated activation functions such as Sigmod and Tanh. When a positive value is given to Leaky ReLU, the output outcome will be the original data; when a negative value is input, the output will be the product between a non-zero slope and the original data. The mathematical expression of Leaky ReLU is as follows:
$$y_{i} = \left\{ \begin{gathered} \, x_{i} \, if \, x_{i} \ge 0 \, \hfill \\ \frac{1}{a}x_{i} \, if \, x_{i} < 0 \hfill \\ \end{gathered} \right.$$(7)where yi represents the output, xi is the input, and a is a constant (its value is 5 in the ACEN). The image of the Leaky ReLU function is shown in Fig. 3.
Fig. 3 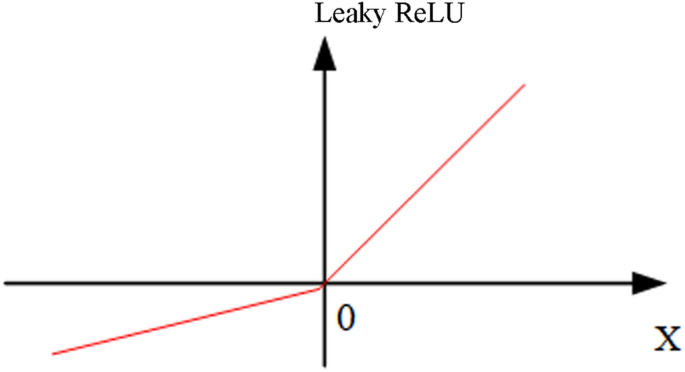
Leaky ReLU function
The Leaky ReLU activation function does not only improve the fitting performance of the network but solves the problem of gradient disappearance and increases the convergence rate of the network as well.
-
(3)
Adjustment of the parameters of the feature capsule layers to improve the adaptability of the network. In the convolution section, the size of the input image and the number of the output categories belong to different concepts. Therefore, adaptive changes are required for the convolution section. The original capsule network adopts one convolution operation for feature extraction. It uses 256 convolutions (size, 9 × 9) to operate upon the images whose size is 28 × 28 × 1 and obtains 20 × 20 × 256-sized feature maps. These feature maps are then input into the feature capsule layers for classification. In the ACEN, the addition of the preconvolution part enables the network to obtain 28 × 28 × 256-sized feature maps, which are then input into the feature capsule layers for further classification.
In the AECN, the feature capsule layers are responsible for the transformation of the feature maps output by the convolution section into capsules. The specific transformation process is that the 28 × 28 × 256-sized feature maps are transformed into 14 × 14 × 256-sized feature maps via convolution operation. During this process, the feature maps are convoluted by 256 3 × 3-sized, 2-step convolution kernels, and 50,176 features are obtained. These features are then divided according to the criterion of 8 features per group to form 6272 capsules, whose size is 8 × 1. The parameters before and after adjustment are summarized in Table 1.
Table 1 Adaptability improvement of the PrimaryCaps layer The dynamic routing algorithm in the category capsule layer primarily consists of the routing between capsules and that inside the capsule. To adapt to the difference between the number of the input capsules and that the output categories in the feature capsule layer, the routing algorithm between capsules undergoes adaptive changes, which aims to improve the performance and expressiveness of the network model.
Dynamic routing operates upon the feature capsules (n = 6272) and weight matrixes, and then map the results into 6 category capsules (these capsules represent the final classification outcomes). That is, the 1 × 6276 feature capsule matrixes multiply the 6276 × 6 weight matrix to obtain a 6 × 1 category capsule matrix. The elements of the category capsule matrix are category capsules that represent different categories. The parameter changes of the category capsule layer are summarized in Table 2.
Table 2 Adaptability improvement of the DigitCaps layer The parameters of the routing inside the capsule remain unchanged. The feature capsules at a length of 8 (the length represents the length of the abstract feature in the image) and the weight matrix are operated and then mapped into the category capsules at a length of 16 (this length represents the length of the category feature); that is, 1 × 8 feature capsule matrixes multiply a 8 × 16 weight matrix to obtain 16 × 1 category capsules. Finally, the length of each category capsule is calculated to obtain the confidence level of the output category belonging to the current category.
-
(4)
Utilization of an adaptive learning rate algorithm to improve gradient smoothness. To let the gradient of the ACEN be smoother during training and thus to adapt to different target functions, we utilized the Adam optimizer to optimize the parameters involved in back propagation. The learning rate was defined at 1 × 10⁻⁹ during optimization. Adam optimizer possesses a high calculation efficiency but requires a low memory. By calculating the first- and second-order moments of the loss gradient to update the learning rate, it is suitable to solve the problems such as gradients containing high noise or sparse gradients, thereby increasing the convergence rate of the training model as well as obtaining optimal solutions.


Experiments
Environment
The hardware environment included an Intel CoreI5-8250U 1.60 GHz processor, an NVIDIA Geforce MX150 graphics card and 16 GB memory. We used the Windows10 operating system and GPU-based deep learning frame to construct the software environment, with python3.7 as the programming language of the experiment program.
Datasets
-
(1)
Murals. The composition of Dunhuang murals is not limited by time, place and natural environment. Dunhuang murals differ essentially from natural images in terms of color, decoration and texture. These differences are specified as follows:
First, the textures of the mural images are more complex. As these images were painted on the wall, their textures are more complex than those of the natural images captured by cameras.
Second, there are color gradient changes in mural images. The paint for mural images was mineral pigments, and the size of the painted area was normally large. Compared with natural images, mural images exhibit certain subjective intentionality in paint use.
Third, the content of mural images is diverse. Dunhuang murals described diverse artistic characters, such as people, Buddha, Bodhisattva and buildings.
Fourth, mural images exhibit subjectivity and polysemy.
In addition, mural images produced in different dynasties also vary greatly in color [22], artistic styles and semantic features [23]. All natural and mural images taken by digital cameras have noise. Image noise due to long exposure, image noise due to image compression in a JPEG format and image noise due to fuzzy filtering all increase noise effect on the image. The pattern of noise in digital images exhibits the dispersion of irregular, abrupt points in continuous tones [24]. Reasonable use of noise in mural images can improve model performance and verify the effectiveness of the model in mural dynasty recognition.
-
(2)
Content of the datasets. In this study, all images in the Dunhuang mural image dataset (DH1926) were from the electronic resource album Complete works of Dunhuang murals in China. According to the time labels annotated in this album, these mural images were divided into categories of Northern Wei, Northern Zhou, Sui, Tang, Five, and West Wei dynasties. A total of 1926 mural images were collected. The number distribution of the mural images in each category is summarized in Table 3, and typical images in each dynasty are shown in Fig. 4.
Table 3 Data composition of the DH1926 dataset Fig. 4 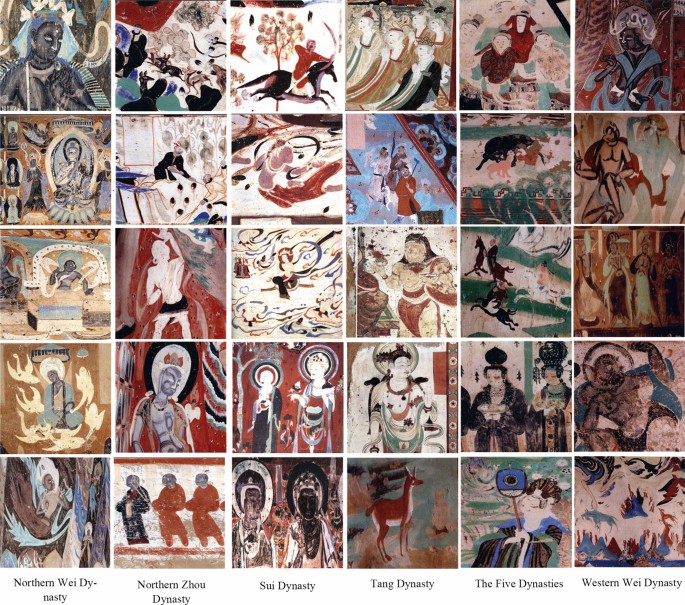
Sample images of various dynasties
The mural images from different dynasties shown in Fig. 4 have unique features in color and composition. The mural images from the Northern Wei and Western Wei categories used red clay as the base, with vivid colors but still composition and lines. From the Sui dynasty, mural images started to fuse with foreign cultural elements, and landscape paintings began to emerge. The mural images from the Tang dynasty are exquisite in character postures, colors and compositions, with red and green as commonly used colors. The characters in the images are characterized with mellow complexion, which are made of white powder. Murals from the Song dynasty in the Five Dynasties period are primarily characterized by the lightly green color; compared those produced in other dynasties, the mural images exhibit more flavor of life in content.
Due to the limited resources of mural images, insufficient training or overfitting may occur. To prevent these problems, we normalized the images to a pixel size of 224 × 224, and then, we processed the original images using data enhancement to expand the number of the mural images from the original 1926 sheets to the current 9630 sheets. Some examples of the images after enhancement are shown in Fig. 5. The methods for data enhancement used in this study included 1.5 times brightening, 90° rotation, 45°rotation and noise addition. In the mural image set of each dynasty, we randomly selected 40 original mural images. These images and their corresponding images obtained after data enhancement, with a total number of 200, are included in the testing set. Therefore, the testing set contained 1200 images in total (as a total of six dynasties were involved). The remaining images, including the enhanced ones, constituted the training set. The number of images of different categories and those of the training and testing sets are summarized in Table 4.
Fig. 5 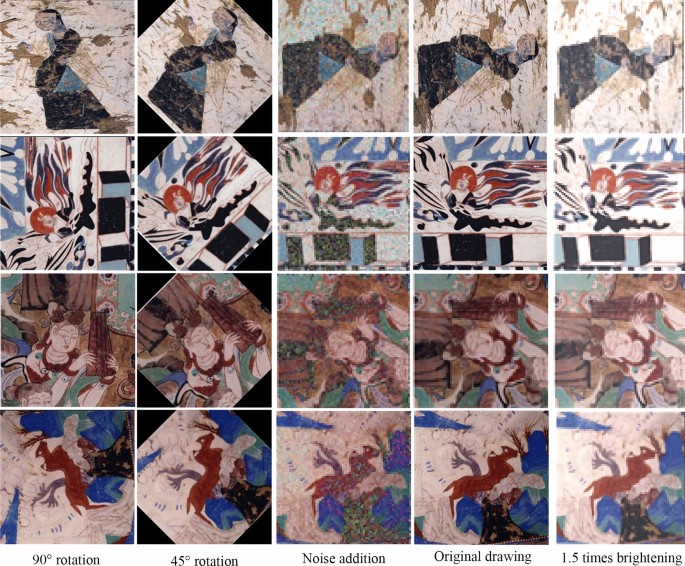
Examples of the images after data enhancement
Table 4 Distribution of the data in different sets As shown in Table 4, the total number of the mural images is 9603 after data enhancement. Expert assessments and the comparison between the experimental outcomes and the annotations of the producing dynasties validated the feasibility of the algorithm used in this study over the DH1926 data set.


Experimental procedures
-
(1)
Determination of the number of the convolution layers. In this study, we added the number of the convolution layers based on the original capsule network to improve the expressiveness of the model and to extract the high-level features of the mural images. To validate the effect of the number of the convolution layers on the expressiveness of the network, we performed comparison experiments in three conditions, i.e., cov-1 (one convolution layer), cov-2 (two convolution layers) and cov-3 (three convolution layers). The results are shown Fig. 6.
Fig. 6 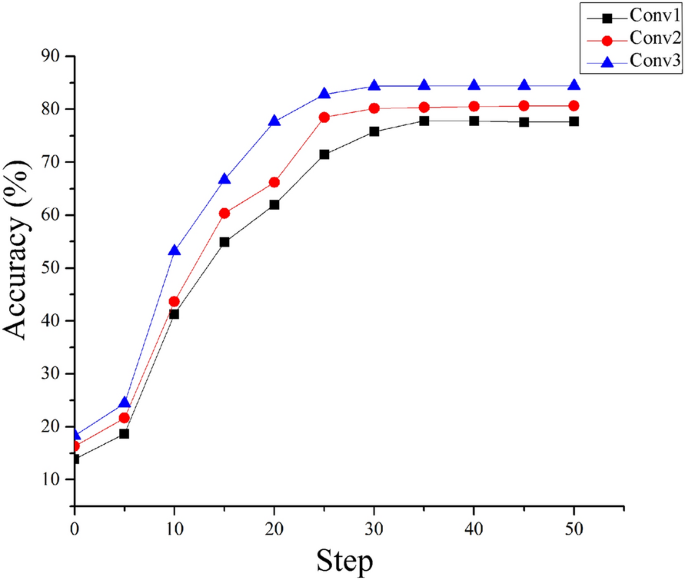
Accuracy comparisons among the models with different numbers of convolution layers
As shown in Fig. 6, with the increase in the number of the convolution layers, the depth of the network increases, and cov-3 exhibits a higher recognition accuracy than the remaining models. The reason for this result is that the increase in the number of the convolution layers enhances the feature expressiveness of the model, which benefits the extraction of abundant local features.
Model parameter setting. After repeated parameter tuning and experiments, the parameters of the model were set as follows: learning rate, 0.001; batch size, 8; epoch value, 50; iterations of route update, 3; optimizer, Adam; and activation function, Leaky ReLU. The network contains three convolution layers, a feature capsule layer and a category capsule layer.

Results and discussion
To demonstrate the satisfactory recognition and classification performance of the proposed ACEN, we performed comparison experiments from two perspectives. First, we tested the efficacies of different activation functions and optimization functions over the DH1926 data set based on the network we proposed in this study. Then, we compared the performance of the proposed network with those of the capsule network CapsNet [10], the VGG16 CNN [15] and the modified CNN convolutional pooling-convolutional pooling convolutional network (CPCPC) over DH1926.
Comparisons among different activation functions
In this experiment, we used three different activation functions, including ReLU, Leaky ReLU and ELU, to assess the final experimental outcomes of the models and their performances during training. The considered indices included average loss, accuracy, average precision (mAP), recall rate, average recall rate (mAR), and the comprehensive assessment value F1.
Average loss refers to the average value of the margin losses for all the images in one test. Accuracy is the ratio between the correct number of samples and the number of all samples in a test. Precision is the ratio of the number of correct samples in a certain category to the total number of retrievals. mAP is the average of the precisions for all the categories. Recall rate is the proportion of the correct samples in a certain category, and mAR is the average of the recall rates for all the categories. F1 is the weighted harmonic average of the precision and accuracy, which is calculated as follows:
Validation of the activation function
The performance of the activation function Leaky ReLU was compared with those of ReLU and ELU, and the variations of the loss results are shown in Fig. 7(a). In this figure panel, step in the x axis means the label every eight tests and Loss in the y axis means the total of the average margin loss value of the eight tests. Among the three considered functions, the loss results of Leaky ReLU are basically the smallest at all steps, which indicates that under the same condition of training times, Leaky ReLU is the most effective function for feature standardization.

Comparison of the results of different activation functions. a Loss results of different activation functions. b Accuracy results of different activation functions. c Comparison of the assessment indices of different activation functions
The variations of the accuracies of the three functions are shown in Fig. 7(b). Under the same training times, Leaky ReLU achieves the highest accuracy. Leaky ReLU also outperforms the remaining functions in terms of the average precision, average recall rate and F1 (Fig. 7(c)).
Comparisons among different optimizers
We compared the performances of five commonly-used optimization functions in the method proposed in this study.
The mAP, mAR and mF1 results of the last test are shown in Fig. 8. The Adam algorithm outperforms the remaining algorithms in all these investigated indices, and therefore is more suitable for the ACEN.

Comparison of the results of different optimization algorithms
Validation of the influence of color and texture on the experimental results
In dynasty recognition, the color, textures and painting styles of mural images have great influence on experimental outcomes. Painting styles are a color-based manifestation, and the dynasty recognition accuracy for mural images with great differences in color and texture is high. Therefore, we performed the comparison experiments along the following two lines:
-
(1)
To validate the influence of the color of mural images on the results of dynasty recognition, we selected part of the images for color modifications (an example is shown in Fig. 9), which were then subjected to dynasty recognition;
-
(2)
To validate the influence of the textures of mural images on the results of dynasty recognition, we adjusted the resolutions of some mural images, which were then subjected to dynasty identification, considering that the variations of the image resolution will directly affect the calculation of the texture feature of the image.

Color adjustment of the mural image. a The original image (299 × 299). b After the gray value is increased. c After the saturation is increased. d After color reversing
As shown in Table 5, after an increase in the gray value and color reversing, both recognition accuracies decreases, with an average decrease of 46%; after the saturation increase, the recognition accuracy decreases by 4%. These results indicate that the model proposed in this study failed to extract the abundant color features of the mural images after part of the features were lost, which led to unsatisfactory feature learning and classification in dynasty identification.
As texture feature can be influenced by resolution, we expanded the original resolution of the images to 3 times and 5 times, and the results of the identification accuracy of the proposed model were summarized in Table 6.
As shown in Table 6, with an increase in the resolution, the texture features of the images turn more vague, and consequently, the final identification accuracy for the images decreases.
As shown in Tables 5 and 6, compared with the changes in the color features of the images, the changes in the texture features had less noticeable influence on the final dynasty identification accuracy of the model proposed in this study. Therefore, color features played a critical role in the mural dynasty identification of the model proposed in this study.
To validate the effectiveness of the proposed model in exacting the color and texture features of mural images, we compared the classification outcomes of the model proposed in this study with those of other modified algorithms and models using the constructed DH1926 as the test data set, and the results are summarized in Table 7.
As shown in Table 7, the final identification accuracy of the algorithm proposed in this study reached up to 84.44%. The main reason for this improvement is that the three added convolution layers helped extract more local features of the images, and therefore, had a more satisfactory color feature extraction and recognition effect. Noticeably, the accuracies of the algorithm proposed in this study were high for the Northern Wei, Northern Zhou, Sui and Western Wei dynasties but low for the Tang dynasty and Five Dynasties. Presumably, the murals of the Tang dynasty primarily used red and green in color, which is similar to light green used in the Five Dynasties and red used in the Northern Zhou and Western Wei dynasties; in addition, these murals have great similarities with those painted in other dynasties in character composition and painting lines. These factors lead to difficulties in identifying and classifying the extracted color features. The murals of the Five Dynasties were drawn by referring to the murals of the Tang Dynasty, and therefore, they bear similarities with those in the Tang Dynasty, no matter in color and painting style or in painting stroke features. For instance, the maid figure in the Five Dynasties continued the plump and mellow characteristics embraced by the Tang Dynasty; furthermore, the painting style of the images produced in the Five Dynasties also continued the style popularized in the Tang Dynasty, which included figure posture, clothing and headdress. Therefore, it is likely to misclassify the murals in the Five Dynasties with those in other dynasties.
Figure 10 shows the confusion matrix of the results of the proposed model in the final test over the six dynasty data sets. The proposed model has satisfactory performance for Five Dynasties, Northern Wei, Northern Zhou, Sui, five and Western Wei. However, its accuracy is low when used for the classification of the murals painted in similar ages. As shown in Fig. 10, the model proposed in this study has the best classification effect for the murals painted in Sui Dynasty but the worst effect for those painted in Tang Dynasty.

Confusion matrix of the model proposed in this study according to the last test. The numbers in the axes, i.e., 1, 2, 3, 4, 5 and 6, represent the Northern Wei, Northern Zhou, Sui, Tang, Five Dynasties and Western Wei historical periods, respectively. The numbers in the matrix indicate the percentages of the numbers of accurate or inaccurate classifications (e.g., 0.94 means 94%), and a deeper color indicates a larger number
Overall structure validation
In the same hardware and software environment, we compared the performance of the overall structure of the model proposed in this study with those of VGG16 [25], CPCPC and CapsNet [11].
VGG16 was composed of 13 convolution layers, 5 pooling layers and 2 fully-connected layers. In the pooling layers, convolution operations were accomplished with different number of convolution kernels with a size of 3 × 3 and a step of 1. In each of the pooling layers, maximum pooling was operated with a sliding window with a size of 2 × 2 and a step of 2. The two fully-connected layers contained 1024 and 6 nodes, respectively. The CPCPC network consisted of 3 convolution layers, 2 pooling layers and 2 fully-connected layers. The convolution layer contained different numbers of convolution kernels with a size of 3 × 3 and a step of 2. The settings of the pooling layers and fully-connected layers were consistent to those of the VGG16 network.
We applied the constructed mural image data set in the four neural networks and trained the networks till the best outcomes were achieved. The comparison results of the four networks in terms of the accuracy, mAP, mAR and mF1 are summarized in Table 8 and Fig. 11.

Comparison of the accuracies of different models for the dynasty recognition of mural images
The results given in Table 8 and Fig. 11 lead to the following findings:
-
(1)
Both VGG16 and CPCPC suffered overfitting after certain times of training, whereas no overfitting occurred to CapsNet and ACEN during the entire training process. This finding indicates that compared with the two-dimensional features extracted by the traditional convolution networks, the high-dimensional features obtained by capsule networks can better extract the features of mural images.
-
(2)
Overfitting occurred earlier to VGG16 than to CPCPC. The reason for this phenomenon may be as follows. In CPCPC, the decreased number of the network layers did not cause overextraction or loss of the image features. In contrast, in VGG16, the increased numbers of the convolution layers and pooling layers caused overextraction of the image features, which was harmful to the improvement of the final classification accuracy. Therefore, in actual practice, the number of network layers should be adapted according to different data sets.
-
(3)
The proposed AECN outperformed CapsNet in both mural recognition and classification. This finding indicates that compared with the mode of direct high-dimensional features extraction from the original image, that of the addition of preconvolution layers for high-level feature extraction followed by transformation of the extracted two-dimensional feature into high-dimensional features for training is more suitable for the dynasty classification of mural images.
Conclusions
In this study, we proposed an AECN model for the identification and classification of the ancient murals in Mogao Grottoes. In this model, we retained the merits of capsule network in image feature extraction. Targeting at the complexity of the extracted features of ancient mural images, we increased the number of convolution layers for preconvolution operation, performed adaptive modifications for the parameters of the feature capsule layers of the original capsule network based on even activation across the convolution layers, and utilized an adaptive optimization algorithm to improve the smoothness of the model. The validation experiments of the activation functions and optimization methods of the ACEN, as well as comparisons of the performance of the AECN with those of other modified algorithms, indicated that the performance of the ACEN in the dynasty recognition was more satisfactory than any other considered network, which is, therefore, of certain realistic and practical significance.
Nevertheless, the dynasty recognition performance of the model proposed in this study primarily relied on the extraction of such features as color and texture from the mural image. Therefore, the resolution of a mural image serves as a critical factor for the final accuracy achieved by the model. Mural images in low resolution may have the deficits of insufficient color and uneven texture, leading to failure in detailed information extraction. Furthermore, the analysis of the single category results in this study showed that the fluctuation effects of the test results for different categories varied, and for some categories, the convergence of the model was not satisfactory, which led to negative influence on the final outcomes. In the future, therefore, to further improve the final classification accuracy of the proposed model, find the reasons that lead to the instability of the test results for some categories and the poor training effect, and explore how to accurately extract the color and texture features of mural images for more accurate dynasty classification of mural images will be important research directions. In addition, the images used for testing and training in this study were all Chinese mural images. Whether the proposed model can achieve similar accuracy in historical period identification for images from other countries remains to be verified.
Availability of data and materials
All data used for analysis in this study are included within the article.
Abbreviations
- AECN:
-
Adaptive enhancement capsule network;
- CNN:
-
Convolutional neural network;
- CPCPC:
-
Convolutional pooling-convolutional pooling convolutional network
References
SI WJ, Leng G. Painting semantic classification method based on image visual feature analysis. In: 2019 international conference on intelligent transportation, changsha: big data & smart city. 2019. p. 578–581.
Zhou YT. Research on Chinese painting image classification method based on improved convolutional neural network model. J Jiamusi Univ (Nat Sci Edition). 2021;39(01):112–5.
Liong S, Huang Y, Li S, et al. Automatic traditional Chinese painting classification: a benchmarking analysis. Comput Intell. 2020;36(3):1183–99.
Wei D. Research on the method of image recognition based on edge calculation in landscape painting. In: 2020 international conference on computers, information processing and advanced education (CIPAE). 2020. p. 232–234.
Li D, Zhang Y. Multi-instance learning algorithm based on LSTM for Chinese painting image classification. IEEE Access. 2020;8:179336–45.
Wang Q, Lu DM. Composition analysis-based relevance ranking for ancient mural. J Zhejiang Univ. 2012;46(3):392–401.
Tang DW, Lu DM, Xu DQ. Mural image classification based on grouped multi-instance learning. Chin J Image Graph. 2014;19(05):708–15.
Tang DW, Lu DM, Yang B, et al. Similarity measure of mural image based on overall contour Structure constraint. Chin J Image Graph. 2013;18(08):968–75.
Zou Q, Cao Y, Li Q, et al. Chronological classification of ancient paintings using appearance and shape features. Pattern Recogn Lett. 2014;49(01):146–54.
Li Q, Zou Q, Ma D. Dating ancient paintings of Mogao Grottoes using deeply learnt visual code. Sci China Inf Sci. 2018;61(9):1–14.
Sabour S, Frosst N, Hinton GE. Dynamic routing between capsules. Advances in neural information processing systems. Long Beach: Neural Information Processing Systems Foundation; 2017. p. 3859–69.
Li HC, Wang WY, Pan L, et al. Robust capsule network based on maximum correntropy criterion for hyperspectral image classification. IEEE J Sel Top Appl Earth Obs Remote Sens. 2020;13:738–51.
Tao ZY, Li J, Tang XL. Texture image classification algorithm combining wavelet transform and capsule network. Laser & Optoelectronics Progress, (2002-6-02) [2021-01-13]. http://kns.cnki.net/kcms/detail/31.1690.tn.20200601.0857.020.html.
Li JQ, Jia XF, Zhao BT. Multi-feature fusion capsule network for image classification. J Harbin Univ Commer (Nat Sci Edition). 2020;36(06):695–700.
Zhang Z, Ye S, Liao P, et al. Enhanced capsule network for medical image classification. In: 2020 42nd annual international conference of the IEEE Engineering in Medicine & Biology Society (EMBC), Canada: Montreal; 2020. p. 1544–1547.
Deng F, Pu SL, Chen XH, et al. Hyperspectral image classification with capsule network using limited training samples. Sensors. 2018;18(9):22.
Afshar P, Mohammadi A, Plataniotis K N. Brain tumor type classification via capsule networks. In: 2018 25th IEEE international conference on image processing (ICIP). 2018.
Koresh HJD, Chacko S. Classification of noiseless corneal image using capsule networks. Soft Comput. 2020;24(1):16201–11.
Xu Q, Wang DY, Luo B. Faster multiscale capsule network with octave convolution for hyperspectral image classification. IEEE Geosci Remote Sens Lett. 2020;99:1–5.
Song Y, Wang Y. Multi-stage attention based capsule networks for image classification. ACTA Autom Sin. 2021;47:1–14.
Tao ZY, Li J, Tang XL. Texture images classification algorithm combining wavelet transform and capsule network. Laser Optoelectron Prog. 2020;57(24):58–68.
Xu WS. A brief analysis of color expression characteristics of Dunhuang frescoes in different dynasties. Fash Tomorrow. 2016;22:197.
Wang XG, Xu L, Li G. Semantic description framework research on Dunhuang fresco digital images. J Libr Sci China. 2014;40(01):50–9.
Chen GQ. Digital image noise and noise reduction. Camera. 2003;2003(10):37–9.
Simonyan K, Zisserman A. Very deep convolutional networks for large-Scale image recognition. [2015-4-10]. https://arxiv.org/abs/1409.1556.
Qian WH, Xu D, Xu J, et al. Research on the classification of style painting based on information entropy. Journal of Graphics 2019;40(06):991–999.
Zhou YZ, Di JS. SAR image classification method based on improved capsule network. Journal of Physics: Conference Series 2020;1693(1).
Acknowledgements
None.
Funding
This work was supported by the Project of Key Basic Research in Humanities and Social Sciences of Shanxi Colleges and Universities (20190130).
Author information
Authors and Affiliations
Contributions
All authors contributed to the current work. JFC devised the study plan, led the writing of the article and supervised the entire process. MMY, HMC, and XDT conducted the experiments and collected the data, and SM performed the analyses.
Corresponding author
Ethics declarations
Competing interests
The authors declare that they have no competing interests.
Additional information
Publisher's Note
Springer Nature remains neutral with regard to jurisdictional claims in published maps and institutional affiliations.
Rights and permissions
Open Access This article is licensed under a Creative Commons Attribution 4.0 International License, which permits use, sharing, adaptation, distribution and reproduction in any medium or format, as long as you give appropriate credit to the original author(s) and the source, provide a link to the Creative Commons licence, and indicate if changes were made. The images or other third party material in this article are included in the article's Creative Commons licence, unless indicated otherwise in a credit line to the material. If material is not included in the article's Creative Commons licence and your intended use is not permitted by statutory regulation or exceeds the permitted use, you will need to obtain permission directly from the copyright holder. To view a copy of this licence, visit http://creativecommons.org/licenses/by/4.0/. The Creative Commons Public Domain Dedication waiver (http://creativecommons.org/publicdomain/zero/1.0/) applies to the data made available in this article, unless otherwise stated in a credit line to the data.
About this article

Cite this article
Cao, J., Yan, M., Chen, H. et al. Dynasty recognition algorithm of an adaptive enhancement capsule network for ancient mural images. Herit Sci 9, 141 (2021). https://doi.org/10.1186/s40494-021-00614-0
Received:
Accepted:
Published:
DOI: https://doi.org/10.1186/s40494-021-00614-0